Statistics | Chapter 6 | 8th Maths - Frequency Distribution Table | 8th Maths : Chapter 6 : Statistics
Chapter: 8th Maths : Chapter 6 : Statistics
Frequency Distribution Table
Frequency
Distribution Table
Frequency distribution:
A frequency
distribution is the arrangement of the given data in the form of the table showing
frequency with which each variable occurs.
There are
two types of distribution table namely
(i) frequency
distribution table for ungrouped data and
(ii) frequency
distribution table for grouped data.
Note
Range: The difference between the largest and the smallest values
of the data given. If 5, 15, 10, 7, 20, 18 are the data then, Range = 20–5=15
Try these
1. Arrange the given data in ascending and descending order: 9,34,4,13,42,10,25,7,31,4,40
Solution:
Ascending order : 4, 4, 7, 9, 10, 13, 25, 31, 34, 40, 42.
Descending order : 42, 40, 34, 31,
25, 13, 10, 9, 7, 4, 4
2. Find the range of the given data : 53, 42, 61, 9, 39, 63, 14,
20, 06, 26, 31, 4, 57
Solution:
Ascending order, of the given data :
4, 6, 9, 14, 20, 26, 31,39, 42, 53, 57, 61, 63
Here largest value = 63
Smallest value = 4
∴ Range = Largest value − smallest
value
= 63 − 4 = 59
1. Construction
of frequency distribution table for ungrouped data
Ungrouped data or Discrete
Data:
An ungrouped
data can assume only whole numbers and exact measurement. These are the data that
cannot have a range of values. A usual way to represent this is by using Bar graphs.
Examples: 1. The number of teachers in a school.
2. The number
of players in a game.
Example 6.1
Form an ungrouped
frequency distribution table for the weight of 25 students in STD IV given below
and answer the following questions.
25, 24, 20,
25, 16, 15, 18, 20, 25, 16, 20, 16, 15, 18, 25, 16, 24, 18, 25, 15, 27, 20, 20,
27, 25.
(i) Find
the range of the weights.
(ii) How
many of the students has the highest weight in the class?
(iii) What
is the weight to which more number of students belong to?
(iv) How
many of them belong to the least weight?
Solution:
To form a
distribution table, arrange the given data in ascending order under Weight column
then, put a vertical mark against each variable under Tally marks column and count
the number of tally marks against the variable and enter it in Frequency column
as given below. Hence, the distribution table is
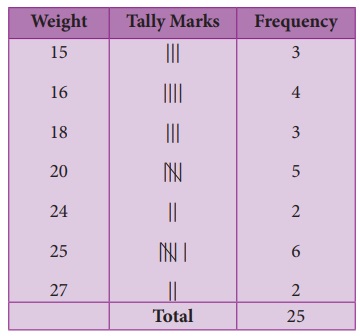
(i) The range
of the given data is the difference between the largest and the smallest value.
Here, the range = 27–15 =12.
(ii) From
this table, two of the students have the highest weight of 27 kg.
(iii) 6 students
belong to 25 kg weight.
(iv) 3 students
belong to the least weight of 15 kg.
So, when
we tabulate the given data, it is easy to get the information at a glance, Isn’t
it?
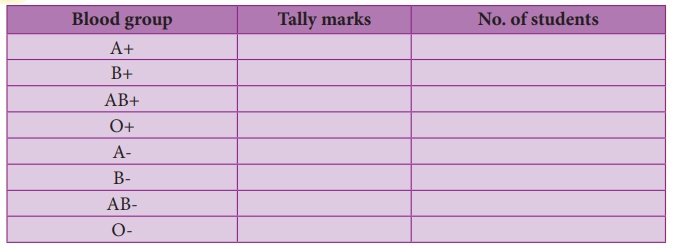
Activity
1. Collect the blood group of your classmates. Complete the table
and analyse.
2. Observe the last alphabet in the name of your classmates, tabulate
them and answer the following questions.
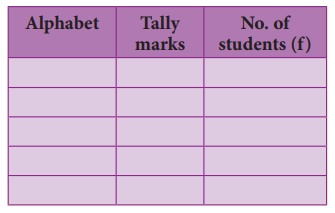
(i) In which letter do the names end the most?
(ii) In which letter do the names end the least?
(iii) What are the letters in which the names do not end with?
(iv) Girl names mostly end with ______ letter(s).
(v) Boy names mostly end with ______ letter(s).
2. Construction
of frequency distribution table for grouped data
Grouped data or Continuous
Data:
A grouped
data is any value within a certain interval. The data can take values between certain
range with the highest and the lowest value. Continuous data can be tabulated in
what is called as frequency distribution. They can be graphically represented using
Histograms.
Example: 1. The age of persons in a village.
2. The height
and the weight of the students of your class.
Now, we will
consider a situation, if we collect data of marks for 50 students, it becomes very
difficult to put tally for each and every marks of all the 50 students. Because
if we arrange the marks in a table, it will be very large in length and not understandable
at once. In this case, we use class intervals. In this table, consider the groups
of data in the form of class intervals to tally the frequency for the given data.
Class Interval:
The range
of the variable is grouped into number of classes,
and each group is known as class interval (C.I). The difference between the upper limit (U) and the lower
limit (L) of the class is known as class size.
i.e. C.I
= Upper limit – Lower limit
For example,
Marks for
the C.I 10 to 20 can be written as 10-20, whose class size is 20–10=10
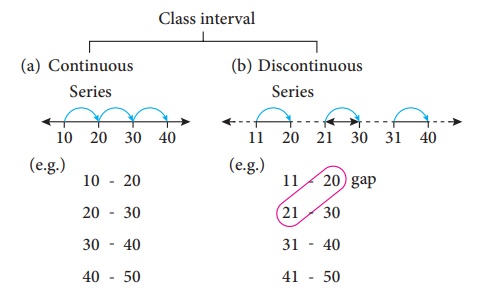
(a) While
distributing the frequency, we follow the counting as given below. Suppose the classes
are 10-20, 20-30, 30-40, 40-50 ..... This represent a continuous series. Here, 20
is included in the class 20-30 and 30 is included in 30-40, likewise for the other
classes also.
(b) In case
the given series has a gap between the limits of any two adjacent classes, this
gap may be filled up by extending the two limits of each class by taking half of
the value of the gap. Half of the gap is called the adjustment factor.
Conversion of a discontinuous series
into continuous series:
In case the
given series is a discontinuous, we can make it as continuous as follows,
Illustration 1:
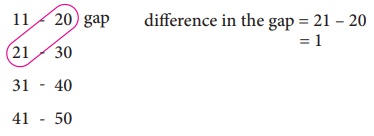
Lower boundary
= lower limit –half of the gap
= 11− 1/2(1)
= 11 – 0.5
= 10.5
Upper boundary
= upper limit + half of the gap
= 20 + 1/2(1)
= 20 + 0.5
20.5 and so on for other classes too.
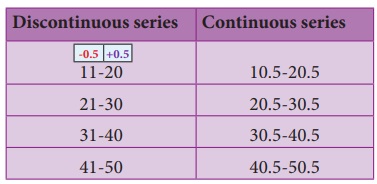
Therefore, the class interval can be changed into a continuous one as given in the following table,
Note
Inclusive series:
In the class-intervals, if the upper limit and lower limit are included
in that class interval then it is called inclusive series. For example, 11-20, 21-30
, 31-40, 41-50 etc is an inclusive series.
Here, the data 11 and 20 are included in the class (11-20) and so
on. Clearly, it is a discontinuous series.
Exclusive series:
In the class intervals, if the upper limit of one class interval
is the lower limit of the next class interval then it is called exclusive series.
For example, 10-15, 15-20, 20-25, 25-30 etc., is an exclusive series.
Here, 15 is included in the class 15-20 and 20 is included in 20-30.
Clearly, it is a continuous series.
2. (i)
Construction of grouped frequency distribution table – Continuous series
Example 6.2
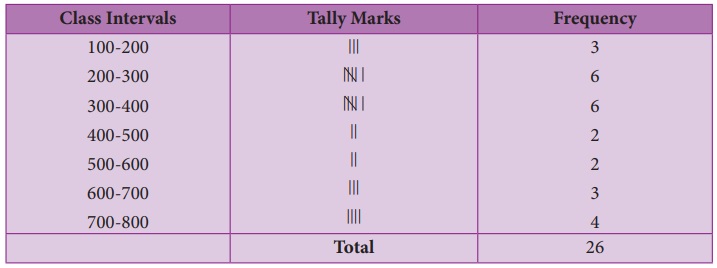
The EB bill(in
₹)
of each of the 26 houses in a village are given below. Construct the frequency table.
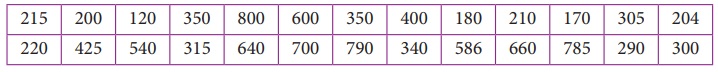
Solution:
Maximum bill
amount = ₹ 800
Minimum bill
amount = ₹ 120
Range = largest
value – smallest value
Range = 800
– 120 = ₹ 680
Suppose if
we want to take class size as 100, then
The number
of possible class intervals = Range/
Class size 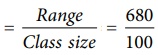 = 680/100 =6.8 ≈ 7
2. (ii)
Construction of grouped frequency distribution table - Discontinuous series.
Example 6.3
Convert the
given discontinuous series into a continuous series.

Solution:
As told above,
first we should fill the gap by extending the two limits of each class by half of
the value of the gap. Here the gap is 1, so subtracting and adding half of the gap
i.e 0.5 to the lower and the upper limit of each class makes it as a continuous
series.

Try these
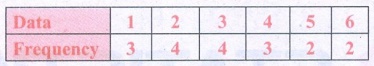
1. Prepare a frequency table for the data : 3,4,2,4,5,6,1,3,2,1,5,3,6,2,1,3,2,4
Solution:
Ascending order of the given data.
1, 1, 1, 2, 2, 2, 2, 3, 3, 3, 3, 4, 4, 4, 5, 5, 6, 6
The distribution table :
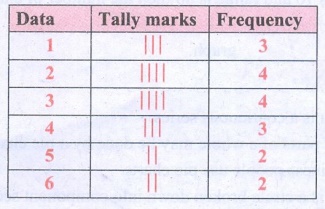
∴ Frequency Table :
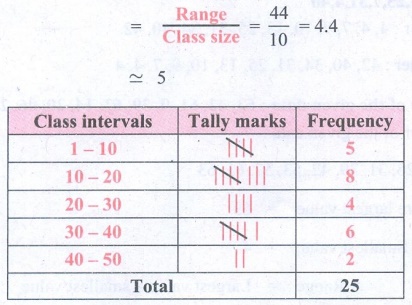
2. Prepare a grouped frequency
table for the data : 10, 9, 3, 29, 17, 34, 23, 20, 39, 42, 5, 12, 19, 47, 18, 19,
27, 7, 13, 40, 38, 24, 34, 15, 40
Solution:
Largest value = 47
Smallest value = 3
Range = Largest value − Smallest value
= 47 − 3 = 44
Suppose we take class size as 10, then Number of class intervals
possible
= Range / Class size = 44 / 10 = 4.4 ≃ 5
Related Topics