Statistics | Chapter 6 | 8th Maths - Summary | 8th Maths : Chapter 6 : Statistics
Chapter: 8th Maths : Chapter 6 : Statistics
Summary
SUMMARY
• Data is
a collection of facts such as numbers, words, measurements and observations.
• A frequency
distribution is the arrangement of the given data in the form of the table showing
frequency with which each variable occurs.
• In the
class-intervals, if the upper limit and lower limit are included in that class interval
then it is called inclusive series.
• In the
class intervals, if the upper limit of one class interval is the lower limit of
the next class interval then it is called exclusive series.
• A pie chart
is a circular graph which shows the total value with its components.
• A histogram
is a graph of a continuous frequency distribution.
• A frequency
polygon is a line graph for the graphical representation of the frequency distribution.
ICT CORNER
Expected Outcome
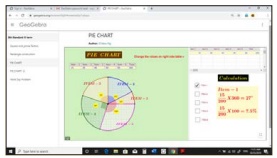
Step-1 Open the Browser type the URL Link given
below (or) Scan the QR Code. GeoGebra work sheet named “8th Standard III term” will
open. Select the work sheet named “PIE CHART”
Step-2 Type your values in the check box on right side. You can observe the change in the pie chart. Click on the check boxes to see respective calculations.
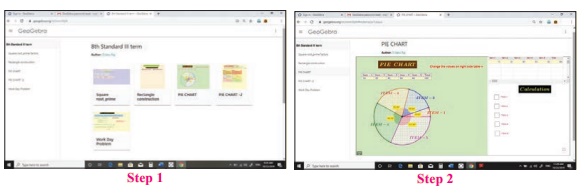
Step 1 Step 2
Browse
in the link
Statistics:
https://www.geogebra.org/m/xmm5kj9r
or Scan the QR Code.
Related Topics