Chapter: Biochemistry: Water: The Solvent for Biochemical Reactions
Titration Curves

Titration Curves
When
base is added to a sample of acid, the pH of the solution changes. A titration is an experiment in which
measured amounts of base are added to ameasured amount of acid. It is
convenient and straightforward to follow the course of the reaction with a pH
meter. The point in the titration at which the acid is exactly neutralized is
called the equivalence point.
If the
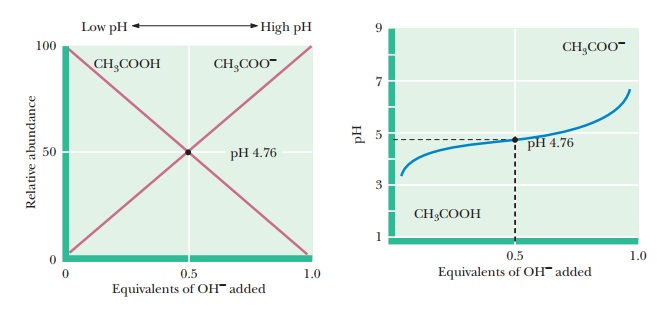
pH is monitored as base is added to a sample of acetic acid in the course of a
titration, an inflection point in the titration curve is reached when the pH
equals the pKa of
acetic acid (Figure 2.13). As we saw in our discussion of the
Henderson–Hasselbalch equation, a pH value equal to the pKa corre-sponds to a mixture with equal concentrations of the weak acid
and its conju-gate base-in this case, acetic acid and acetate ion,
respectively. The pH at the inflection point is 4.76, which is the pKa of
acetic acid. The inflection point occurs when 0.5 mol of base has been added
for each mole of acid present. Near the inflection point, the pH changes very
little as more base is added.

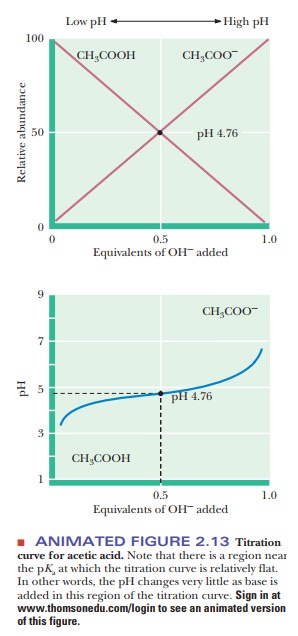
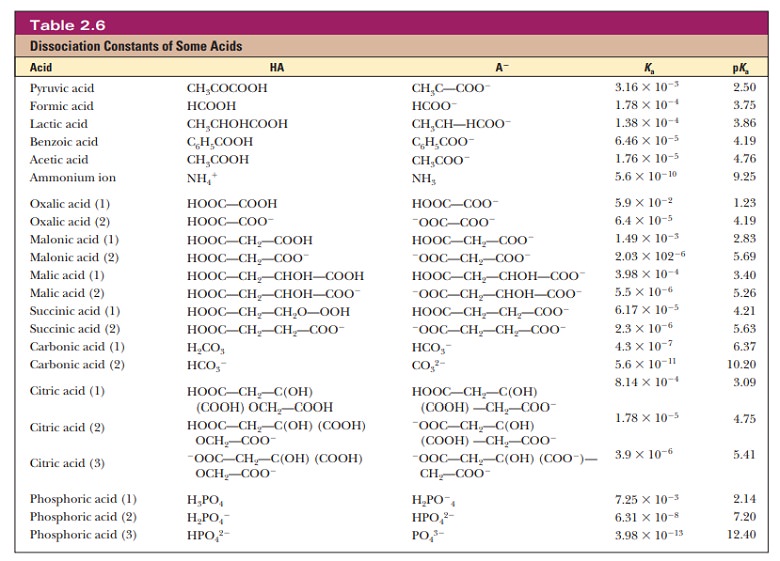
When 1 mol of base has been added for each mole of acid, the equivalence point is reached, and essentially all the acetic acid has been converted to ace-tate ion. Figure 2.13 also plots the relative abundance of acetic acid and acetate ion with increasing additions of NaOH. Notice that the percentage of acetic acid plus the percentage of acetate ion adds up to 100%. The acid (acetic acid) is progressively converted to its conjugate base (acetate ion) as more NaOH is added and the titration pro-ceeds. It can be helpful to keep track of the percentages of a conjugate acid and base in this way to understand the full significance of the reaction taking place in a titration. The form of the curves in Figure 2.13 represents the behavior of any monoprotic weak acid, but the value of the pKa for each individual acid determines the pH values at the inflection point and at the equivalence point Table 2.6 lists values for the acid dissociation constant, Ka, and for the pKa for a number of acids.

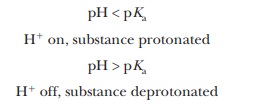
Note that these acids are categorized into three groups. The first group consists of monoprotic acids, which release one hydrogen ion and have a single Ka and pKa. The second group consists of diprotic acids, which can release two hydrogen ions and have two Ka values and two pKa values. The third group consists of polyprotic acids, which can release more than two hydrogen ions. The two examples of polyprotic acids given here, citric acid and phosphoric acid, can release three hydrogen ions and have three Ka values and three pKa values. Amino acids and peptides, behave as diprotic and polyprotic acids; we shall see examples of their titration curves later. Here is a way to keep track of protonated and deprotonated forms of acids and their conjugate bases, and this can be particularly useful with diprotic and polyprotic acids. When the pH of a solution is less than the pKa of an acid, the protonated form predominates. (Remember that the definition of pH includes a negative logarithm.) When the pH of a solution is greater than the pKa of an acid, the deprotonated (conjugate base) form predominates.

Summary
In aqueous solution, the relative
concentrations of a weak acid and its conjugate base can be related to the
titration curve of the acid.
In the
region of the titration curve in which the pH changes very little upon addition
of acid or base, the acid/base ratio varies within a narrow range (10:1 at one
extreme and 1:10 at the other extreme).
Related Topics