Statistical Methods and Econometrics - Standard Deviation (σ) | 12th Economics : Chapter 12 : Introduction to Statistical Methods and Econometrics
Chapter: 12th Economics : Chapter 12 : Introduction to Statistical Methods and Econometrics
Standard Deviation (σ)
Standard Deviation (σ)
The measures of central tendency serve to locate the center of the
distribution, but they do not reveal how the items are spread out on either
side of the center. This characteristic of a frequency distribution is commonly
referred to as dispersion. The degree of variation is evaluated by various
measures of dispersion. There are two kinds of measures of dispersion, namely
1. Absolute measure of dispersion
2. Relative measure of dispersion
Absolute measure of dispersion indicates the amount of variation in a set of
values in terms of units of observations.
Relative measures of dispersion are free from the units of measurements of the
observations. They are pure numbers. They are used to compare the variation in
two or more sets, which are having different units of measurements of
observations.
Standard Deviation is
one of the methods of Absolute
measure of dispersion. Karl
Pearson introduced the concept of standard deviation in 1893. Standard
deviation is also called Root- Mean Square Deviation. The reason is that it is
the square–root of the mean of the squared deviation from the arithmetic mean.
It provides accurate result. Square of standard deviation is called Variance.
Definition:
It is defined as the positive square-root of the arithmetic mean
of the square of the deviations of the given observation from their arithmetic
mean.
The standard deviation of the population is denoted by the Greek
letter σ (sigma) The standard deviation of sample is
denoted as 's'.
Calculation of Standard deviation- Individual Series:
There are two methods of calculating Standard deviation in an
individual series.
a) Deviations taken from Actual mean
b) Deviation taken from Assumed mean
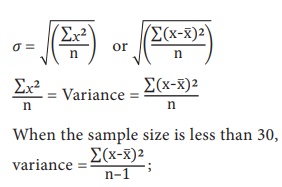
Standard Deviation = 
Where, x̅ = mean value of distribution
n = number of observations.
Steps:
1. Find out the actual mean of given data(X̅ )
2. (Find out the deviation of each value from the mean (x ⁼
X – X̅ )
3. Square the deviations ∑x2 and take the total of
squared deviations ∑x2
4. Divided the total ∑x2 by the number of observation (∑x2/n)
5. The square root of (∑x2/n) is standard
deviation.

When n = number of observations.
Example 1: Calculate the standard deviation from the following data by
Actual Mean Method: 25, 15, 23, 42, 27, 25, 23, 25, and 20.

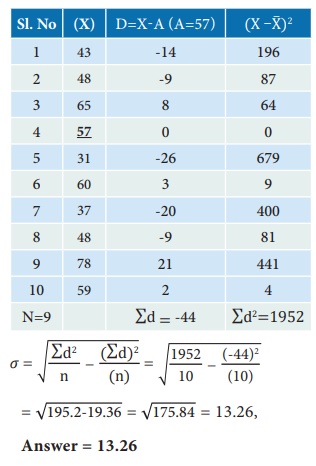
Example 2: Calculate the standard deviation for the following data by assumed
mean method: 43, 48, 65, 57, 31, 60, 37, 48, 78, 59
Solution: Deviation from assumed mean

Related Topics