Statistical Methods and Econometrics - Regression | 12th Economics : Chapter 12 : Introduction to Statistical Methods and Econometrics
Chapter: 12th Economics : Chapter 12 : Introduction to Statistical Methods and Econometrics
Regression
Regression
Evolution of Regression
The term ‘Regression’ was first coined and used in 1877 by Francis
Galton while studying the relationship between the height of fathers and sons.
The average height of children born of parents of a given height tended to move
or “regress” toward the average height in the population as a whole. Galton’s
law of universal regression was confirmed by his friend Karl Pearson, who
collected more than a thousand records of heights of members of family groups.
The literal meaning of the word “regression” is “Stepping back towards the
average”.
Regression is the study of the relationship between the variables.
If Y is the dependent variable and X is independent variable, the linear
relationship between the variable is called the regression equation of Y on X,
The regression equation is used to estimate the value of Y corresponding to the
known value of X. The line describing this tendency to regress or going back
was called by Galton a “Regression Line”.
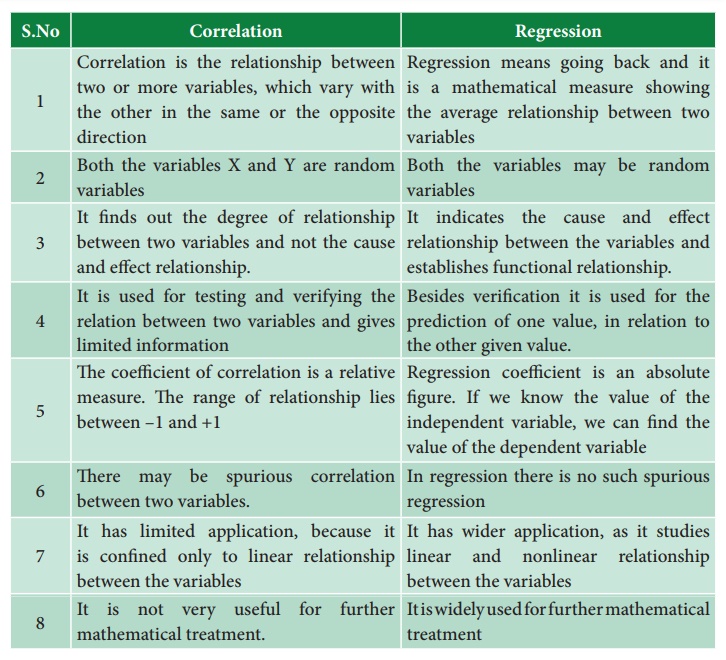
Difference between Correlation and Regression
Correlation
1. Correlation is the relationship between two or more variables,
which vary with direction
2 Both the variables X and Y are random variables
3. It finds out the degree of relationship between two variables
and not the cause and effect relationship.
4. It is used for testing and verifying the relation between two
variables and gives limited information
5. The coefficient of correlation is a relative measure. The
range of relationship lies between –1 and +1
6. There may be spurious correlation between two variables.
7. It has limited application, because it is confined only to
linear relationship between the variables
8. It is not very useful for further mathematical treatment.
Regression
1. Regression means going back and it is a mathematical measure
showing the other in the same or the opposite the average relationship between
two variables
2. Both the variables may be random variables
3. It indicates the cause and effect relationship between the
variables and establishes functional relationship.
4. Besides verification it is used for the prediction of one
value, in relation to the other given value.
5. Regression coefficient is an absolute figure. If we know the
value of the independent variable, we can find the value of the dependent variable
6. In regression there is no such spurious regression
7. It has wider application, as it studies linear and nonlinear
relationship between the variables
8. It is widely used for further mathematical treatment
Two Regression lines
X on Y => X = a + by
Y on X => Y = a + bx
Regression line is the line which gives the best estimate of
one variable from the value of any other given variable. The line gives
the average relationship
between the two variables in mathematical form. The line of regression is
the line which gives the best estimate to the value of one variable for any
specific value of the other variable.
To fit Regression equations X on Y and Y on X the following
examples are given
Ex 1: Fit two regression equation X on Y and Y on X for the following
data.Xbar= 12, Ybar=10, σy= 0.2, σx =0.1 and r = 0.85
Solution
The regression X on Y is
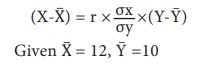
r = 0.85, σx = 0.1 and σy = 0.2
Then substituting the values in formula
Then substituting the values in formula
(X-12) = 0.85 × (0.1/0.2) × (Y-10)
(X-12) = 0.85 × (0.5) × (Y-10)
X = 0.425 ×(Y-10)+ 12
X = 0.425Y- 4.25+12
X = 0.425Y+7.75
X on Y
Answer X = 0.425Y + 7.75
The regression Y on X is
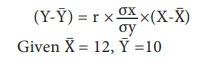
r = 0.85, σx = 0.1 and σy = 0.2
Then substituting the values in formula
(Y-10) = 0.85 × (0.2/0.1) × (X–12)
(Y-10) = 0.85 × (2) × (X–12)
Y = 1.7 × (X–12) + 10
Y = 1.7X–20.4+10
Y = 1.7X–10.4
Y on X
Answer Y = 1.7X–10.4
Related Topics