Chapter: Software Project Management
Software Project Management: Activity Planning
ACTIVITY PLANNING
1. Objectives
2. Project Schedule
3. Sequencing and Scheduling Activities
4. Network Planning Models
5. Forward Pass
6. Backward Pass
7. Activity Float
8. Shortening Project Duration
9. Activity on Arrow Networks
10. Risk Management
11. Nature Of Risk
12. Types Of Risk
13. Managing Risk
14. Hazard Identification
15. Hazard Analysis
16. Risk Planning And Control
1. Objectives of activity planning
Feasibility assessment-Whether project can be
finished within specified time scales
Resource allocation
Detailed costing-Cost?
Motivation
Co-ordination
2. Project schedules
Steps
– Ideal activity plan
– Activity risk analysis
– Resource allocation
– Schedule production
Projects
and activities
Defining activities
Identifying activities
Identifying activities
The activity based approach
The product based approach
The hybrid approach
3. Sequencing and scheduling activities
Project plan-bar chart
SSADM
Take into account availability of staff
Way of allocation
4. Network-Planning Models
A project is made up of a sequence of activities
that form a network representing a project.
The path taking longest time through this network
of activities is called the “critical
path.”
The critical path provides a wide range of
scheduling information useful in managing a project.
Critical Path Method (CPM) helps to identify the
critical path(s) in the project
networks.
CPM with a Single Time Estimate
Used when
activity times are known with certainty.
Used to
determine timing estimates for the project, each activity in the project, and
slack time for activities.
CPM with Three Activity Time Estimates (a.k.a.
PERT)
Used when
activity times are uncertain.
Used to
obtain the same information as the Single Time Estimate model andprobability information.
Time-Cost Models
Used when
trade-off information cost is a major consideration in planning.
Used to
determine the least cost in reducing total project time.
Example:.
CPM with Single Time Estimate
Consider
the following consulting project
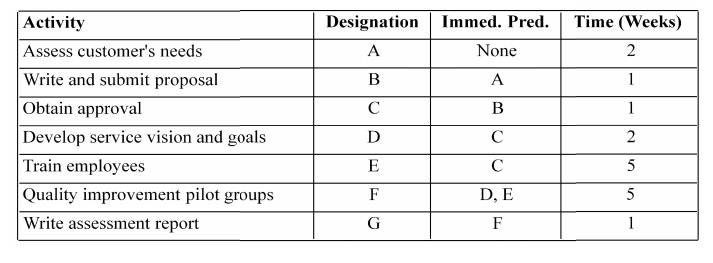
Develop a
critical path diagram ( network) and determine the duration of the critical
path and Slacktimes for all activities
Draw the
network
Compute
early starts and early finish times (forward pass)
Compute
late starts and l ate finish times (backward pass)
Compute
Slack (LS-ES) per activity and Critical Path(s)
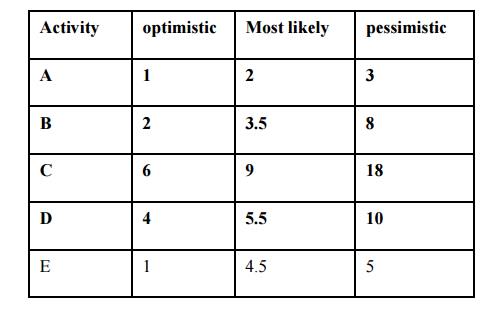
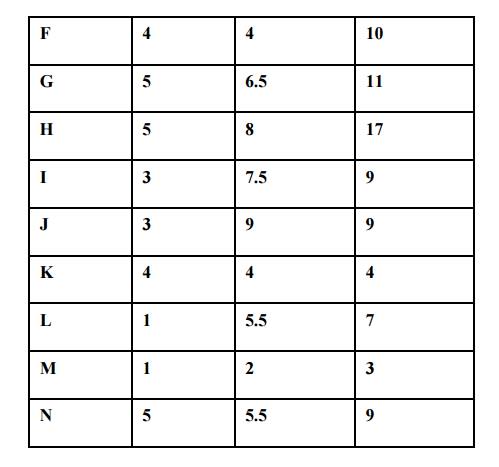
Example2. CPM with Three A ctivity Time Estimates
Develop a
critical path diagram ( network) and determine the duration of the critical
path and Slacktimes for all activities
Draw the
network
Compute
early starts and early finish times (forward pass)
Compute
late starts and l ate finish times (backward pass)
Compute
Slack (LS-ES) per activity and Critical Path(s) What is the probability of
finishing this project in less than 53 days? What is the probability that the p
roject duration will exceed 56 days?
Time-Cost
Models
Sometimes it is possible to "crash"
(expedite) some activities thus reducing the overall completion time
for the entire project.
Crashing an activity implies spending additional
funds (e.g., overtime costs, hiring more workers, and so on) to get the task
done earlier.
On many
occasions reducing the project completion time that in turn reduces the fixed
cost outlays can generate substantial savings.
Draw the
CPM network, identify the CP
Identify
the least cost activity(ies) on the critical path(s)
Shorten
the project completion time (CP) at the least cost Repeat until no more
crashing is possible (or cost exceeds the benefits)
Assume fixed costs = $1,000 day.
Find the optimum time-cost schedule.
CPM
Assumptions/Limitations
Project activities can be identified as entities.
(There is a clear beginning and ending point for each activity.)
Project activity sequence relationships can be
specified and networked.
Project control should focus on the critical path.
The activity times follow the beta distribution,
with the variance of the project assumed to equal the sum of the variances
along the critical path. Project control should focus on the critical path.
MS Project
MS Project is very popular and inexpensive project
management software.
It is constantly improved (upgraded).
Many independent software firms have developed
“add-ons” to further improve or help users (managers) take full advantage of
its capabilities.
For example, probabilistic analysis (PERT approach)
is not directly available in MS Project.
CAUTION: “PERT”
in MS Project refers to the AON network representation, and simplistic
project duration calculations done by using either optimistic or most likely or
pessimistic time estimates for all activities.
Risk+ developed by C/S Solutions “is a
comprehensive risk analysis tool that integrates seamlessly with Microsoft®
Project to quantify the cost and schedule uncertainty associated with your
project plans.”
Reliable
Construction Company Project
This is a mini case/group exercise.
The Reliable Construction Company has just made the
winning bid of $5.4 million to construct a new plant for a major manufacturer.
The contract includes the following provisions:
A penalty
of $300,000 if Reliable has not completed construction within 47 weeks.
A bonus
of $150,000 if Reliable has completed the plant within 40 weeks.
Questions:
How can the project be displayed graphically to
better visualize the activities?
What is the total time required to complete the
project if no delays occur?
When do the individual activities need to start and
finish?
What are the critical bottleneck activities?
For other activities, how much delay can be
tolerated?
What is the probability the project can be
completed in 47 weeks?
Is it worth to expedite the activities to finish
the project in 40 weeks?
– Assume activities with 7 or more weeks can be
shortened by two weeks and the rest can be reduced by only one week.
– For simplicity assume that cost per week to
expedite any activity is $30,000.
Three Time Estimates for the Project
5,6. Forward and backward pass
Why
Network Diagrams?
Splits up the decision making process into
Method/logic
- the order in which tasks have to be completed
Time –
estimates for the time to completion can be added to each task
Resources
– these can be added and then analysis carried out
Two Parts
to the Analysis
Forward Pass
Calculates
the Duration of the Project
Backward Pass
Calculates
the slack/float for each task and shows the critical path
To
calculate the total duration of the Project…
For each
task:
Take the
earliest start time (EST)
Calculate the Earliest finish time (EFT):
EFT = EST+Duration
Backward Pass
To
calculate the float for each task?
For each
task:
Take the
latest start time (LST)
Calculate
the latest finish time (LFT):
LST =
LFT-Duration
7. ACTIVITY FLOAT MEASURES
Free float
The time
by which an activity may be delayed without affecting any specific activity
Interfering float
The diff
between the total float and free float
Reducing
Project Duration
Time Is Money: Cost-Time Tradeoffs
– Reducing the time of a critical activity
usually incurs additional direct costs.
Cost-time
solutions focus on reducing (crashing) activities on the critical path to
shorten overall duration of the project.
– Reasons for imposed project duration dates:
Time-to-market
pressures
Unforeseen
delays
Incentive
contracts (bonuses for early completion)
Imposed
deadlines and contract commitments
Overhead
and public goodwill costs
Pressure
to move resources to other projects
Options
for Accelerating Project Completion
Resources Not Constrained
– Adding resources
– Outsourcing project work
– Scheduling overtime
– Establishing a core project team
– Do it twice—fast and then correctly
Resources Constrained
– Fast-tracking
– Critical-chain
– Reducing project scope
– Compromise quality
Explanation
of Project Costs
Project Indirect Costs
– Costs that cannot be associated with any
particular work package or project activity.
Supervision, administration, consultants, and
interest
– Costs that vary (increase) with time.
Reducing project time directly reduces indirect
costs.
Project Direct Costs
Normal
costs that can be assigned directly to
a
specific work package or project activity.
Labor, materials, equipment, and
subcontractors
–
Crashing activities increases direct costs.
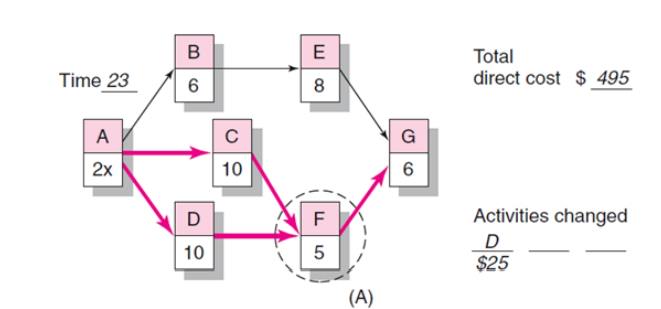
Reducing Project Duration
Project Cost–Duration Graph
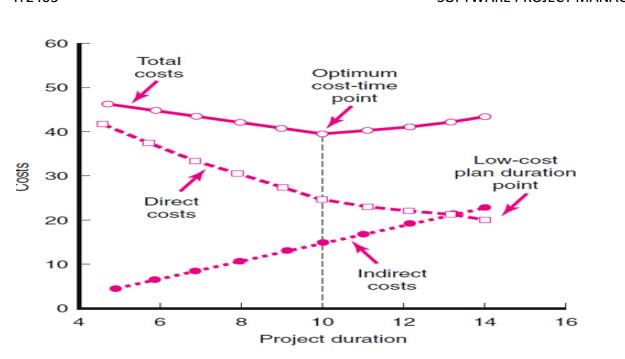
Constructing a Project Cost–Duration Graph
Findtotal direct costs for selected project
durations.
Find total indirect costs for selected project
durations.
Sum direct and indirect costs for these selected
project durations.
Compare additional cost alternatives for benefits.
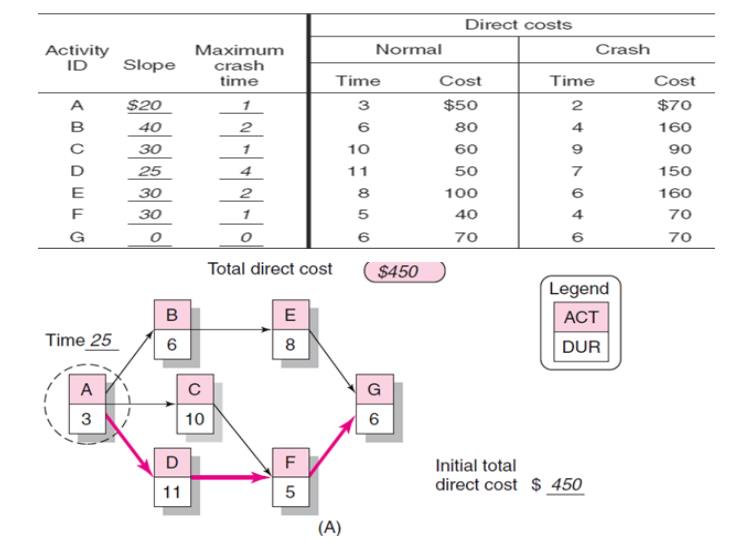
Constructing
a Project Cost–Duration Graph
Determining
Activities to Shorten
– Shorten the activities with the smallest
increase in cost per unit of time.
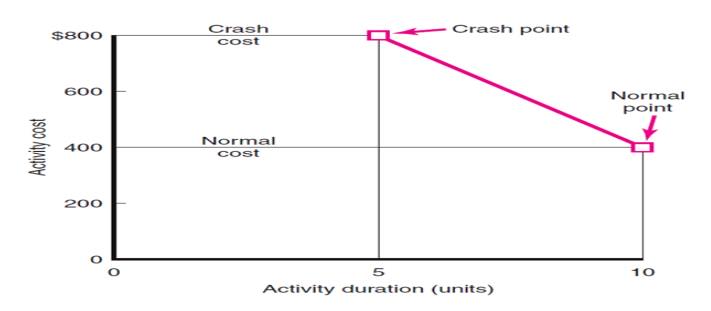
– Assumptions:
The cost relationship is linear.
Normal time assumes low-cost, efficient methods to
complete the activity.
Crash time represents a limit—the greatest time
reduction possible under realistic conditions.
Slope represents a constant cost per unit of time.
All accelerations must occur within the normal and
crash times.
Activity Graph
Cost–Duration Trade-off Example
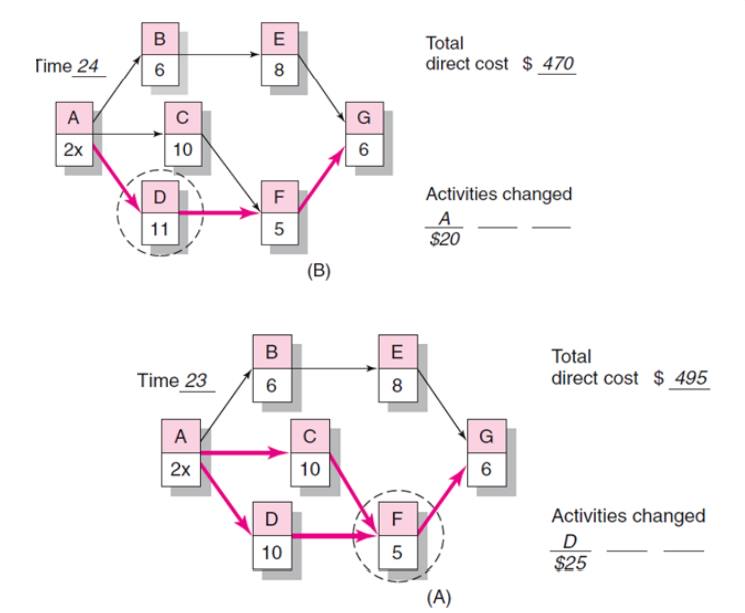
Practical Considerations
Using the
Project Cost–Duration Graph
Crash
Times
Linearity
Assumption
Choice of
Activities to Crash Revisited
Time
Reduction Decisions and Sensitivity
What if Cost, Not Time Is the Issue?
Commonly
Used Options for Cutting Costs
– Reduce project scope
– Have owner take on more responsibility
– Outsourcing project activities or even the
entire project
– Brainstorming cost savings options
Constructing
a Project Network
Terminology
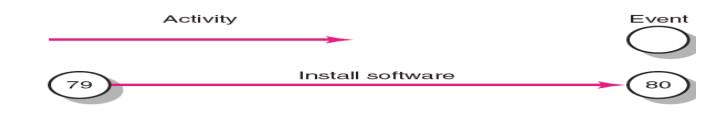
Activity:
an element of theproject that requires time.
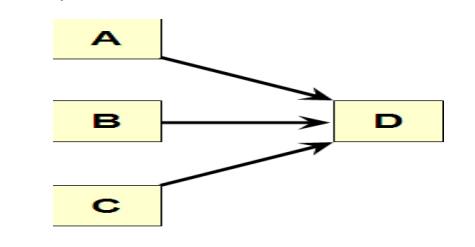
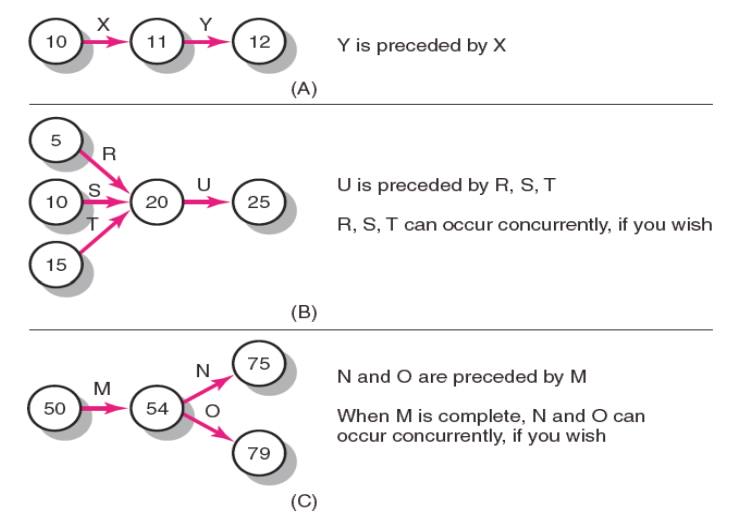
Merge
activity: an activity that has two or more preceding activities on which it
depends.
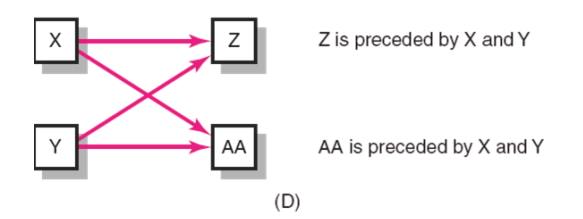
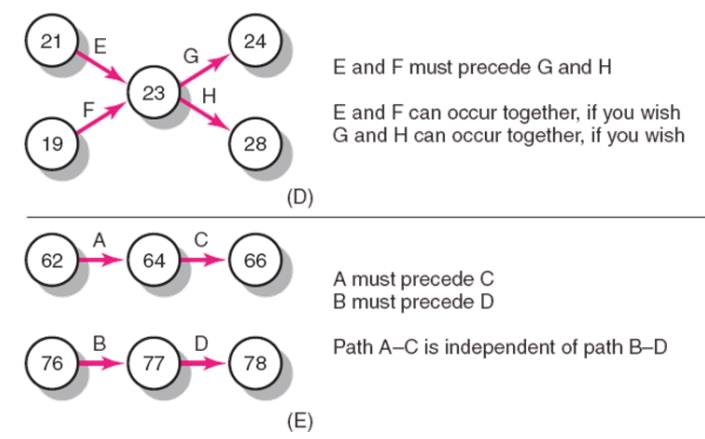
Parallel
(concurrent) activities: Activities that can occur independently and, if
desired, not at the same time.
Activity-on-Node Fundamentals
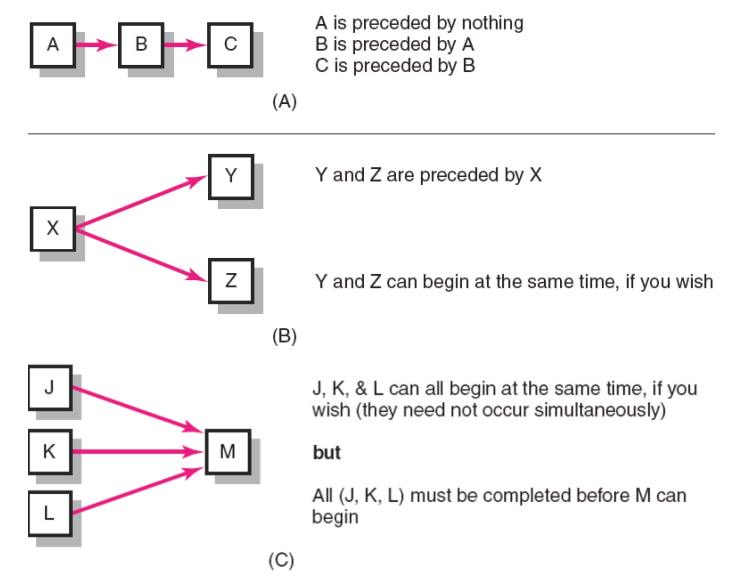
Path: a
sequence of connected, dependent activities.
Critical
path: the longest path through the activity network that allows for the
completion of all project-related activities; the shortest expected time in
which the entire project can be completed. Delays on the critical path will
delay completion of the entire project.
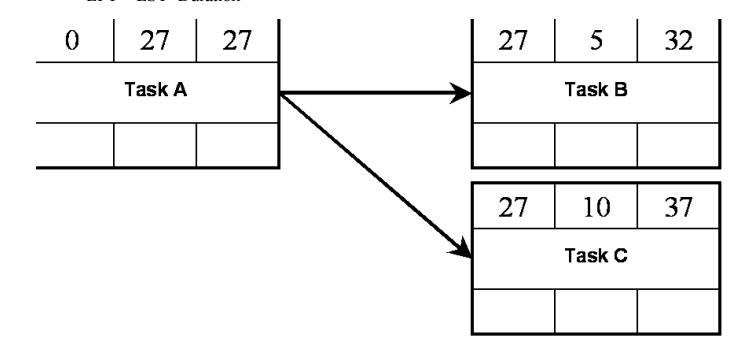
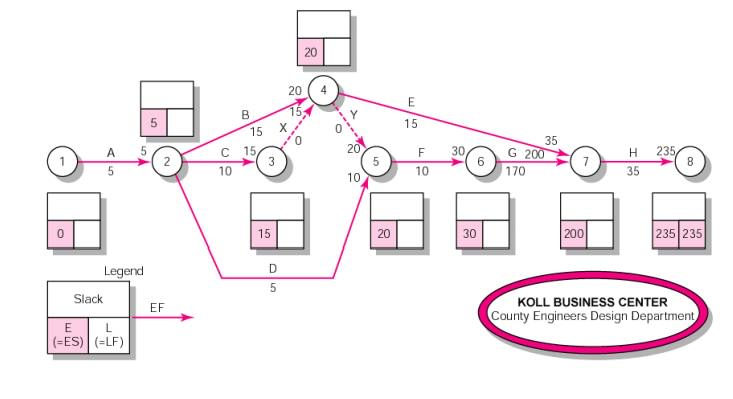
Forward Pass Computation
Add
activity times along each path in the network (ES + Duration = EF).
Carry the
early finish (EF) to the next activity where it becomes its early start (ES)
unless…
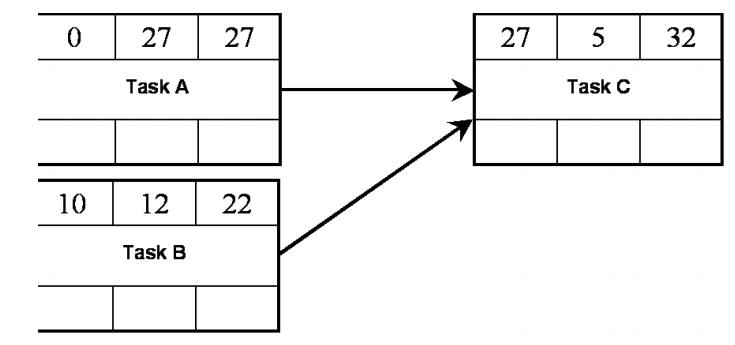
The next
succeeding activity is a merge activity, in which case the largest EF of all
preceding activities is selected.
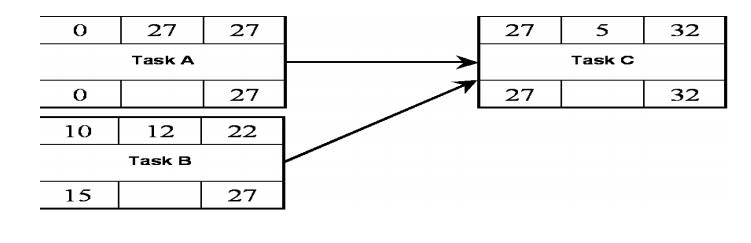
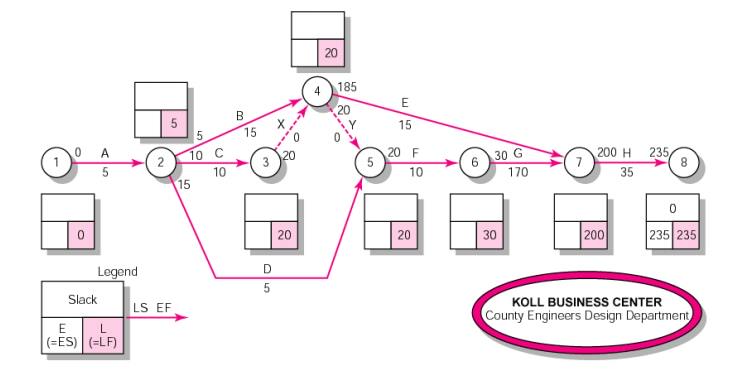
Backward Pass Computation
Subtract
activity times along each path in the network (LF - Duration = LS).
Carry the
late start (LS) to the next activity where it becomes its late finish (LF)
unless...
The next
succeeding activity is a burst activity, in which case the smallest LF of all
preceding activities is selected.
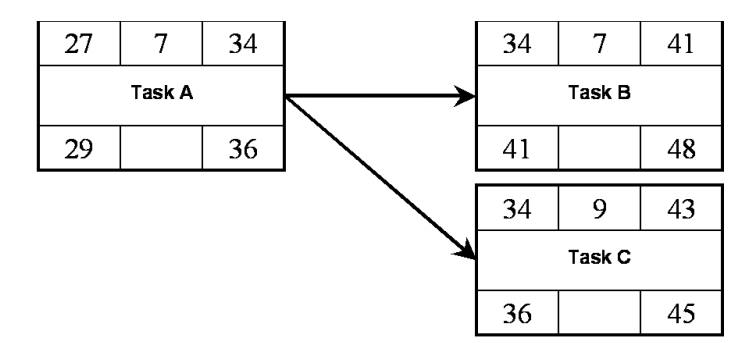
Determining Slack (or Float)
Free
Slack (or Float)
The amount
of time an activity can be delayed without delaying connected successor
activities
Total
Slack
The
amount of time an activity can be delayed without delaying the entire project
The
critical path is the network path(s) that has (have) the least slack in common.
Sensitivity of a Network
The
likelihood the original critical path(s) will change once the project is
initiated.
§ Function of:
The
number of critical paths
The
amount of slack across near critical activities
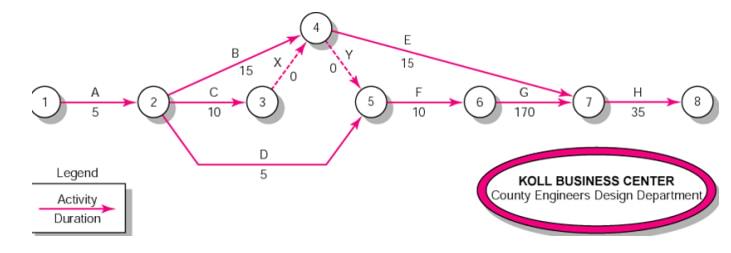
9. Activity-on-Arrow Network-Building Blocks
Activity-on-Arrow Network Fundamentals
1 Partial AOA Koll Network
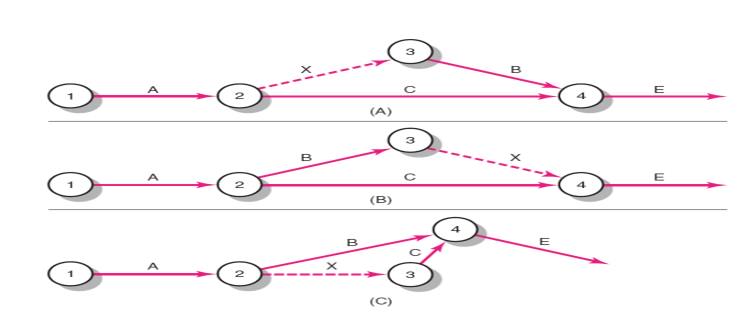
2 Activity – on-Arrow Network
3 Activity – on-Arrow Network Forward Pass
4 Activity-on-Arrow Network Backward Pass
10 Risk Management
The
proactive management of risks throughout the software development lifecycle is
important for project success.
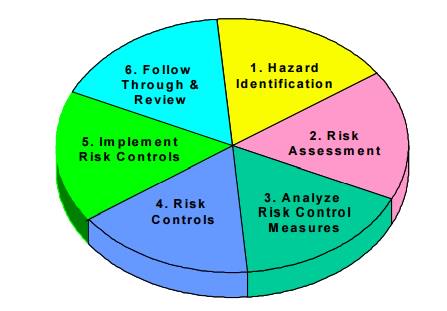
The risk
management practice, which involves risk identification, analysis,
prioritization, planning, mitigation, monitoring, and communication
software
development risks that seem to reoccur in educational and industrial projects
a
risk-driven process for selecting a software development model
1Risk Identification
In the
risk identification step, the team systematically enumerates as many project
risks as possible to make them explicit before they become problems. There are
several ways to look at the kinds of software project risks.
There are
some specific factors to consider when examining project, product, and business
risks. Some examples of these factors are listed here, although this list is
meant to stimulate your thinking rather than to be an all-inclusive list.
People
risks are associated with the availability, skill level, and retention of the
people on the development team.
Size
risks are associated with the magnitude of the product and the product team.
Larger products are generally more complex with more interactions. Larger teams
are harder to coordinate.
Process
risks are related to whether the team uses a defined, appropriate software
development process and to whether the team members actually follow the
process.
Technology
risks are derived from the software or hardware technologies that are being
used as part of the system being developed. Using new or emerging or complex
technology increases the overall risk.
Tools
risks, similar to technology risks, relate to the use, availability, and
reliability of support software used by the development team, such as
development environments and other Computer-Aided Software Engineering (CASE)
tools.
Organizational
and managerial risks are derived from the environment where the software is
being developed. Some examples are the financial stability of the company and
threats of company reorganization and the potential of the resultant loss of
support by management due to
a change
in focus or a change in people.
Customer
risks are derived from changes to the customer requirements, customers’ lack of
understanding of the impact of these changes, the process of managing these
requirements changes, and the ability of the customer to communicate
effectively with the team and to accurately convey the attributes of the
desired product.
Estimation
risks are derived from inaccuracies in estimating the resources and the time
required to build the product properly.
Sales and
support risks involve the chances that the team builds a product that the sales
force does not understand how to sell or that is difficult to correct, adapt,
or enhance.
2 Strategies for Risk Management:
During
the software development process various strategies for risk management could
be identified and defined according to the amount of risk influence. Based upon
the amount of risk influence in software development project, risk strategies
could be divided into three classes namely careful, typical, and flexible
(Boban, M. et.). Generally, careful risk management strategy is projected for
new and inexperienced organizations whose software development projects are
connected with new and unproven technology; typical risk management strategy is
well-defined as a support for mature organizations with experience in software
development projects and used technologies, but whose projects carry a decent
number of risks; and flexible risk management strategy is involved in
experienced software development organizations whose software development
projects are officially defined and based on proven technologies (Boban, M.
etc.).
3 Categories of risks: Schedule Risk:
Project schedule get slip when project tasks and schedule
release risks are not addressed properly.
Schedule risks mainly effect on
project and finally on company economy and may lead to project failure.
Schedules often slip due to following reasons:
Wrong time estimation
Resources are not tracked properly. All resources like staff,
systems, skills of individuals etc.
Failure to identify complex functionalities and time required to
develop those functionalities.
Unexpected project scope expansions.
Budget Risk:
Wrong budget estimation.
Cost overruns
Project scope expansion
Operational Risks:
Risks of loss due to improper process implementation, failed
system or some external events risks.
Causes of Operational risks:
Failure to address priority conflicts
Failure to resolve the responsibilities
Insufficient resources
No proper subject training
No resource planning
No communication in team.
Security in System Development
Risk
Analysis & Management needs to be a part of system development, not tacked
on afterwards
Baskerville's
three generations of methods
1st Generation: Checklists
Example:
BS 7799 Part 1
2nd Generation: Mechanistic engineering methods
Example:
this risk analysis method
3rd Generation: Integrated design
Not yet
achieved
Definitions:
The
meanings of terms in this area are not universally agreed. We will use the
following
Threat: Harm that can happen to an
asset
Impact: A measure of the seriousness of
a threat
Attack: A threatening event
Attacker: The agent causing an attack
(not necessarily human)
Vulnerability: a weakness in the system that
makes an attack more likely to succeed
Risk: a quantified measure of the
likelihood of a threat being realised
Risk Analysis involves the identification and
assessment of the levels of risk, calculated from the
Values of
assets
Threats
to the assets
Their
vulnerabilities and likelihood of exploitation
Risk Management involves the identification,
selection and adoption of security measures
justified by
The
identified risks to assets
The
reduction of these risks to acceptable levels
Goals of Risk Analysis:
All
assets have been identified
All
threats have been identified
Their
impact on assets has been valued
All
vulnerabilities have been identified and assessed
Problems of Measuring Risk
Businesses
normally wish to measure in money, but
Many of
the entities do not allow this
Valuation
of assets
– Value of data and in-house software - no
market value
– Value of goodwill and customer confidence
Likelihood
of threats
– How relevant is past data to the calculation
of future probabilities?
– The nature of future attacks is unpredictable
– The actions of future attackers are
unpredictable
Measurement
of benefit from security measures
– Problems with the difference of two
approximate quantities
– How does an extra security measure affect a
~10-5 probability of attack?
Risk Levels
Precise
monetary values give a false precision
Better to
use levels, e.g.
High,
Medium, Low
– High: major impact on the organisation
– Medium: noticeable impact (“material” in
auditing terms)
– Low: can be absorbed without difficulty
1 - 10
Express
money values in levels, e.g.
For a
large University Department a possibility is
– High
– Medium
– Low
Risk Analysis Steps
Decide on
scope of analysis
Set the
system boundary
Identification
of assets & business processes
Identification
of threats and valuation of their impact on assets (impact valuation)
Identification
and assessment of vulnerabilities to threats
Risk
assessment
Risk Analysis – Defining the Scope
Draw a
context diagram
Decide on
the boundary
It will
rarely be the computer!
Make
explicit assumptions about the security of neighbouring domains
Verify
them!
Risk Analysis - Identification of Assets
Types of
asset
Hardware
Software:
purchased or developed programs
Data
People:
who run the system
Documentation:
manuals, administrative procedures, etc
Supplies:
paper forms, magnetic media, printer liquid, etc
Money
Intangibles
– Goodwill
– Organization confidence
– Organisation image
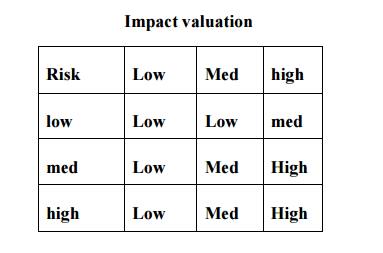
Risk Analysis – Impact Valuation
Identification and valuation of threats - for
each group of assets
Identify threats, e.g. for stored data
Loss of confidentiality
Loss of integrity
Loss of completeness
Loss of availability (Denial of Service)
For many asset types the only threat is loss of
availability
Assess impact of threat
Assess in
levels, e.g H-M-L or 1 - 10
This
gives the valuation of the asset in the face of the threat
Risk Analysis – Vulnerabilities
• Identify
vulnerabilities against a baseline system
For risk
analysis of an existing system
– Existing system with its known security measures
and weaknesses For development of a new system
– Security facilities of the envisaged
software, e.g. Windows NT
– Standard good practice, e.g. BS 7799
recommendations of good practice
For each
threat
Identify
vulnerabilities
How to
exploit a threat successfully;
Assess
levels of likelihood - High, Medium, Low
Of
attempt
Expensive
attacks are less likely (e.g. brute-force attacks on encryption keys)
Successful
exploitation of vulnerability;
Combine
them
Risk Assessment
Assess risk
If we had
accurate probabilities and values, risk would be
Impact
valuation x probability of threat x probability of exploitation
Plus a
correction factor for risk aversion
Since we
haven't, we construct matrices such as
Responses to risk
Avoid it
completely by withdrawing from an activity
Accept it
and do nothing
Reduce it
with security measures
Risk management
Risk
management is concerned with identifying risks and drawing up plans to minimisetheir
effect on a project.
A risk is
a probability that some adverse circumstance will occur
Project
risks affect schedule or resources;
Product
risks affect the quality or performance of the software being developed;
Business risks affect the organisation developing or procuring the software.
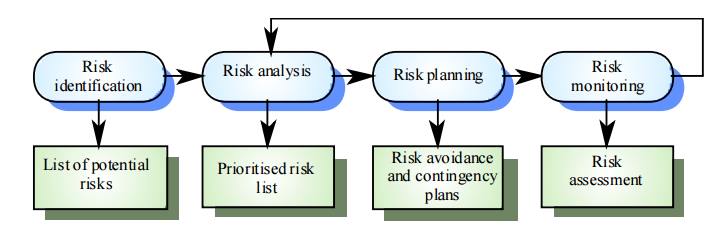
The risk management process
Risk identification
Identify
project, product and business risks;
Risk analysis
Assess
the likelihood and consequences of these risks;
Risk planning
Draw up
plans to avoid or minimise the effects of the risk;
Risk monitoring
Monitor
the risks throughout the project;
14. Hazard Identification
Systematic Processes
What Constitutes a Hazard?
A real or
potential condition that, when activated, can transform into a series of
interrelated events that result in damage to equipment or property and or
injury to people.
Safety Managers View
Hazard
An
implied threat or danger, a potential condition waiting to become a loss
Stimulus
Required
to initiate action from potential to kinetic
May be a:
Component
out of tolerance
Maintenance
failure
Operator
failure
Any
combination of other events and conditions
When Do We Look for Hazards?
The 5
Common Phases of a Systems Life Cycle
Conceptual
- Research
Design (Validation & Verification)
Development
(Full-scale engineering & production)
Operational
Deployment
Termination
& Disposal
Hazard Severity
A key
factor in establishing a common understanding of a safety programs goal
MIL-STD 882
suggests four categories
Cat 1:
Catastrophic
Cat 2:
Critical
Cat 3:
Marginal
Cat 4:
Negligible
15. Hazard Analysis Methods
Failure
Modes & Effects Analysis (FMEA)
Systematic
look at hardware piece by piece
Review of
how each component could fail
Considers
how a failure effects other components, sub-systems and systems as a whole
Risk
assessment accomplished (severity & probability)
Risk
Assessment Code (RAC) assigned
Fault
Tree Analysis (FTA)
Detailed
review of a specific undesirable event
Deductive
in nature
Top-down
effort
Normally
reserved for critical failures or mishaps
May be qualitative or quantitative
Operating Hazard Analysis (OHA)
Also
known as Operating & Support Hazard Analysis (O&SHA)
“What if”
tool brings user into the loop
Integrates people and procedures into the system
Diagrams
the flow or sequence of events
Project Evaluation Tree (PET) may be used for OHA
accomplishment
Systematic
evaluation of man, machine, & procedures
PURPOSE
OF THE RISK MANAGEMENT PLAN
A risk is
an event or condition that, if it occurs, could have a positive or negative
effect on a project’s objectives. Risk Management is the process of
identifying, assessing, responding
to,
monitoring and controlling, and reporting risks. This Risk Management Plan defines
how risks associated with the<Project Name> project will be identified,
analyzed, and managed. It outlines how risk management activities will be
performed, recorded, and monitored throughout the lifecycle of the project and
provides templates and practices for recording and prioritizing risks by the
Risk Manager and/or Risk Management Team.
Risks
related to IT systems or applications must be identified and documented based
on the methodology in NIST SP 800-30, Risk Management Guide for Information Technology
Systems. IT system or application weaknesses must be identified on an
associated plan of action and milestones (POA&M) and tracked in accordance
with HHS POA&M guidelines. Appropriate protective measures must be taken to
safeguard sensitive IT system or application weaknesses or vulnerabilities from
unauthorized disclosure.
16 RISK RESPONSE PLANNING
Each
major risk (those falling in the Red & Yellow zones) will be assigned to a
risk owner for monitoring and controlling purposes to ensure that the risk will
not “fall through the cracks”.
For each
major risk, one of the following approaches will be selected to address it:
Avoid – Eliminate the threat or condition or
to protect the project objectives from its
impact by eliminating the cause
Mitigate – Identify ways to reduce the
probability or the impact of the risk
Accept – Nothing will be done
Contingency
–Define
actions to be taken in response to risks
Transfer – Shift the consequence of a risk to a
third party together with ownership of the
response by making another party responsible for the risk (buy insurance,
outsourcing, etc.)
RISK
MONITORING, CONTROLLING, AND REPORTING
The level
of risk on a project will be tracked, monitored and controlled and reported
throughout
the project lifecycle. [Describe the methods and metrics that will be used to
track the project’s risk status throughout the lifecycle as well as how this
status will be reported to the
stakeholders/
management.]
Risks
will be assigned a risk owner(s) who will track, monitor and control and report
on the status and effectiveness of each risk response action to the Project
Manager and Risk
Management
Team on a <insert timeframe>.
A “Top 10
Risk List” will be maintained by the PM/Risk Manager or IPT and will be
reported as a component of the project status reporting process for this
project.
All
project change requests will be analyzed for their possible impact to the
project risks. As Risk Events occur, the list will be re-prioritized during
weekly reviews and risk
management
plan will reflect any and all changes to the risk lists including secondary and
residual risks.
Management
will be notified of important changes to risk status as a component to the
Executive Project Status Report. [State timeframe, i.e., every two weeks]
The Risk
Manager (PM) will:
Review, reevaluate, and modify the probability and
impact for each risk item [timeframe, as needed, every two weeks, etc.]
Analyze any new risks that are identified and add
these items to the risk list (or risk database).
Monitor and control risks that have been identified
Review and update the top ten risk list [timeframe,
as needed, every two weeks, etc.]
Escalate issues/ problems to management [List
factors that would need to be escalated to management. Examples: documented
mitigation actions are not effective or producing the desired results; the
overall level of risk is rising.]
The Risk
Owner will:
Help develop the risk response and risk trigger and
carry out the execution of the risk response, if a risk event occurs.
Participate in the review, re-evaluation, and
modification of the probability and impact for each risk item on a weekly
basis.
Identify and participate in the analysis of any new
risks that occur.
Escalate issues/problems to PM that,
Significantly
impact the projects triple constraint or trigger another risk event to occur.
Require
action prior to the next weekly review
Risk
strategy is not effective or productive causing the need to execute the
contingency plan.
Related Topics