Definition, Formula, Solved Example Problems - Quartiles | 11th Statistics : Chapter 5 : Measures of Central Tendency
Chapter: 11th Statistics : Chapter 5 : Measures of Central Tendency
Quartiles
Quartiles
There are three quartiles denoted by Q1, Q2 and Q3 divides the frequency distribution in to four equal parts
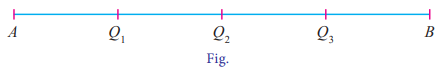
That is 25 percent of data will lie below Q1, 50 percent of data below Q2 and 75 percent below Q3. Here Q2 is called the Median. Quartiles are obtained in almost the same way as median
Quartiles for Raw or Ungrouped data:
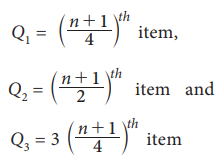
If the data set consist of n items and arranged in ascending order then
Example 5.30
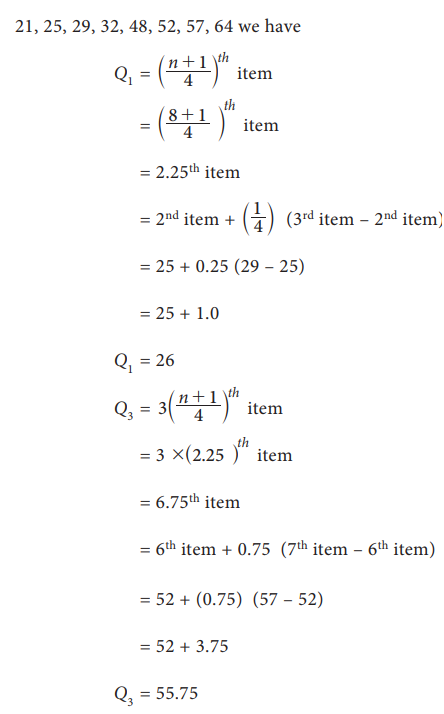
Compute Q1 and Q3 for the data relating to the marks of 8 students in an examination given below 25, 48, 32, 52, 21, 64, 29, 57
Solution:
n = 8
Arrange the values in ascending order
21, 25, 29, 32, 48, 52, 57, 64 we have
Quartiles for Discrete Series (grouped data)
Step 1: Find cumulative frequencies
Step 2 : Find ((N+1)/ 4)
Step 3 : See in the cumulative frequencies, the value just greater than ((N+1)/ 4) the corresponding value of x is Q1
Step 4 : Find 3((N+1)/ 4)
Step 5 : See in the cumulative frequencies, the value just greater than 3((N+1)/ 4) then the corresponding value of x is Q3.
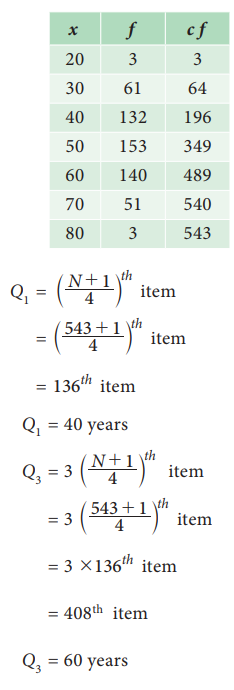
Example 5.31
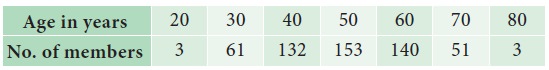
Compute Q1 and Q3 for the data relating to age in years of 543 members in a village
Solution:
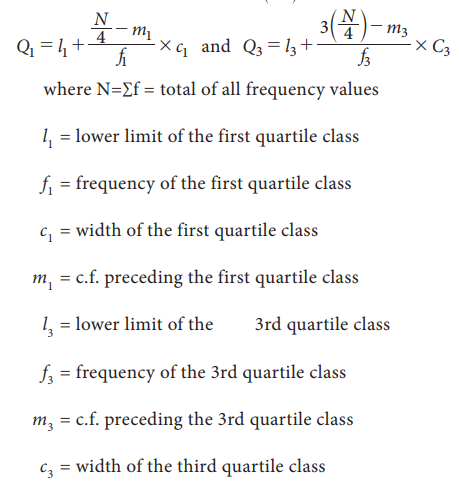
Quartiles for Continuous series (grouped data)
Step 1: Find cumulative frequencies
Step 2 : Find (N/4)
Step 3 : Q1 class is the class interval corresponding to the value of the cumulative frequency just greater than (N/4)
Step 4 : Q3 class is the class interval corresponding to the value of the cumulative frequency just greater than 3 (N/4)
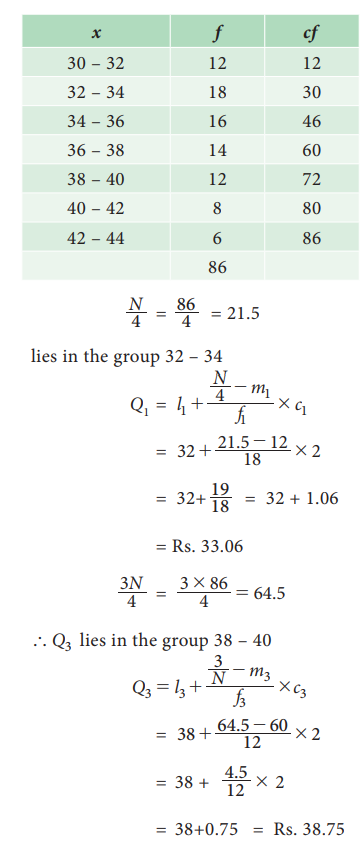
Example 5.32
Calculate the quartiles Q1 and Q3 for wages of the labours given below
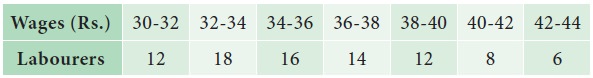
Solution:
Related Topics