Chapter: Organic Chemistry: Organic spectroscopy and analysis
Mass spectroscopy
MASS SPECTROSCOPY
Key Notes
Introduction
A mass
spectrum is obtained by ionizing a molecule to give a molecular ion. This is
then accelerated through a magnetic field and the ion is deviated according to
its mass and charge. Routinely, ionization is carried out by electron
ionization, but chemical ionization and fast atom bombardment are milder
methods. Detecting the molecular ion allows identification of the molecular
weight. If this is an odd number it indicates that an odd number of nitrogen
atoms are present.
Isotopic ratios
The
pattern of peaks present for a molecular ion can reveal the presence of
chlorine or bromine since there are two naturally occurring isotopes for these
elements. Carbon also has two naturally occurring isotopes (12C and 13C)
and so a small peak is often observed one mass unit higher than the molecular
ion.
Fragmentation patterns and daughter ions
The
molecular ion is unstable and fragments, producing daughter ions. The
fragmentation patterns that take place are indicative of functional groups in
the molecule. Daughter ions vary in stability and the more stable ones give
stronger peaks. The most intense peak in the spectrum is called the base peak.
Analysis of a mass spectrum
The
molecular ion and base peak are identified first. Daughter ions are then
identified and fragmentation patterns determined.
High-resolution mass spectroscopy
High-resolution
mass spectroscopy is used to measure the mass of a molecular ion to four
decimal places. This allows the determination of the molecular formula002E
Introduction
Mass spectroscopy is useful in the analysis of
an organic compound since it can provide information about the molecular
weight, the presence of specific elements (e.g. nitrogen, chlorine or bromine)
and the presence of specific functional groups. Put at its simplest, a mass
spectrum measures the mass of ions, but to be more precise, it is a measure of
the mass/charge ratio (m/e). However, the vast majority of ions detected are
singly charged (e=1). In order to obtain a mass spectrum, the molecules of the
test compound have to be ionized under reduced pressure. Thereare several ways
in which this can be carried out, but the most common method is known as electron ionization (EI)
Electron ionization involves bombarding the
test molecule with high-energy electrons such that the molecule loses an
electron and ionizes to give a radical cation called a molecular ion (also called the parent
ion). This molecular ion is then accelerated through a magnetic field towards
a detector. The magnetic field causes the ion to deviate from a straight path
and the extent of deviation is related to mass and charge (i.e. the lighter the
ion the greater the deviation). Assuming a charge of 1, the deviation will then
be a measure of the mass. The mass can then be measured to give the molecular
weight.
The mass of a molecular ion must be even unless
the molecule contains an odd number of nitrogen atoms. This is because nitrogen
is the only ‘organic’ element with an even mass number and an odd valency.
Therefore, an odd numbered mass for a molecular ion is an indication of the
presence of at least one nitrogen atom.
Sometimes, the molecular ion is not observed in
the spectrum. This is because electron ionization requires compounds to be
vaporized at high temperature and the molecular ion may fragment before it can
be detected. In cases like this, it is necessary to carry out the ionization
under milder conditions such that the mole-cular ion is less likely to fragment
(i.e. by chemical ionization or by fast atombombardment). You may ask why
these milder conditions are not used routinely.The reason is that fragmentation
can give useful information about the structure of the molecule (see below).
The molecular ion peak is usually strong for
aromatic amines, nitriles, fluorides and chlorides. Aromatic and heteroaromatic
hydrocarbons will also give intense peaks if there are no alkyl side chains
present greater than a methyl group. How-ever, the peaks for molecular ions can
be absent for long chain hydrocarbons, highly branched molecules, and alcohols.
Isotopic ratios
The pattern of peaks observed for a molecular
ion often indicates the presence ofparticular halogens such as chlorine or
bromine. This is because each of these elements has a significant proportion of
two naturally occurring isotopes. Since the position of the peaks in the mass
spectrum depends on the mass of each individual molecular ion, molecules
containing different isotopes will appear at different positions on the spectrum.
Chlorine occurs naturally as two isotopes (35Cl and 37Cl
) in the ratio 3 : 1. This means that the spectrum of a compound containing a
chlorine atom will have two peaks for the molecular ion. The two peaks will be
two mass units apart with a ratio of 3 : 1. For example ethyl chloride
will have two peaks for C2H535Cl
and C2H537Cl at m/e 64 and 66 in a ratio of 3
: 1. The naturally abundant isotope for carbon is 12C. However, the 13C
isotope is also present at a level of 1.1%. This can result in a peak one mass
unit above the molecular ion. For methane, the relative ratios of the peaks due
to 12CH4 and 13CH4 is 98.9 : 1.1,
and so the peak for 13CH4 is very small. However, as the
number of car-bon atoms increase in a molecule, there is a greater chance of a
molecule contain-ing a 13C isotope. For example, the mass spectrum
for morphine shows a peak at m/e 308 and a smaller peak at m/e 309 which is
about a fifth as intense. The peak at m/e 308 is due to morphine containing
carbon atoms of isotope 12. The peak at 309 is due to morphine where one of the
carbon atoms is 13C (i.e. 13C12C16H18NO3).
The intensity of the peak can be rationalized as follows. The natural abundance
of 13C is 1.1%. In morphine there are 17 carbon atoms and so this
increases the chances of a 13C isotope being present by a factor of
17. Hence, the peak at 309 isapproximately 18% the intensity of the molecular
ion at 308.
Fragmentation patterns and daughter ions
The molecular ion is not the only ion detected
in a mass spectrum. The molecularion is a high-energy species, which fragments
to give daughter ions that are
alsodetected in the spectrum. At first sight, fragmentation may seem to be a
random process,but fragmentation patterns are often characteristic of certain
functional groups and demonstrate the presence of those groups.
Due to fragmentation, a mass spectrum contains
a large number of peaks of varying intensities. The most intense of these peaks
is known as the base peak and is
usually due to a relatively stable fragmentation ion rather than the molecular
ion. Examples of stable ions are the tertiary carbonium (R3C+),
allylic (=C-CR2+), benzylic (Ar-CR2+),
aromatic (Ar+), oxonium (R2O+) and immonium (R3N+)
ions.
It is not possible to explain every peak
observed in a mass spectrum and only the more intense ones or those of high
mass should be analyzed. These will be due to relatively stable daughter ions.
Alternatively, a fragmentation may result in a stable radical. The radical
being neutral is not observed, but the other half of the fragmentation will
result in a cation which is observed.
Many fragmentations give a series of daughter
ions that are indicative of a particular functional group. In other words, the
molecular ion fragments to a daughter ion, which in turn fragments to another
daughter ion and so on.
The intensity of a peak may sometimes indicate
a favored fragmentation route. However, care has to be taken since intense
peaks can arise due to different frag-mentation routes leading to the same ion,
or be due to different fragmentation ions of the same m/e value.
Analysis of amass spectrum
To illustrate the analysis of a mass spectrum,
we shall look at the simple alkanenonane (Fig.
1).
Nonane has a molecular formula of C9H20 and a molecular weight of 128. Theparent ion is the molecular ion at 128. There is a small peak at m/e 129, which is due to a molecule of nonane containing one 13C isotope (i.e. 12C813CH20). The nat-ural abundance of 13C is 1.1%. Therefore the chances of a 13C isotope being present in nonane are 9 × 1.1% = 9.9%.
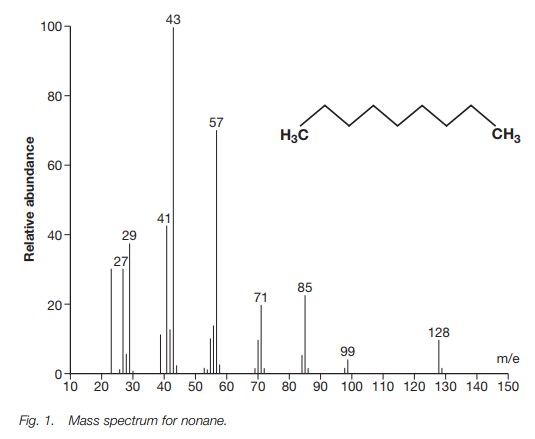
The base peak is at m/e 43. This is most likely
a propyl ion [C3H7]+. There are peaks at m/e
29, 43, 57, 71, 85 and 99. These peaks are all 14 mass units apart which
corresponds to a CH2 group. The presence of a straight chain alkane
is often indicated by peaks which are 14 mass units apart (Fig. 2).
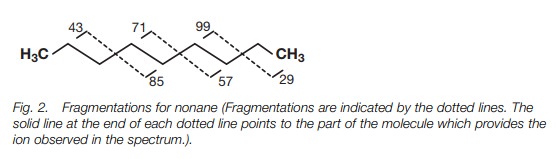
The characteristic peaks for a straight chain
alkane are 14 mass units apart, but this does not mean that the chain is being
‘pruned’ one methylene unit at a time. Decomposition of carbocations occurs
with the loss of neutral molecules such as methane, ethene and propene, and not
by the loss of individual methylene units. For example, the daughter ion at m/e
99 can fragment with loss of propene to give the ion at m/e 57. The daughter
ion at m/e 85 can fragment with loss of ethene or propene to give the ions at
m/e 57 and m/e 43 respectively. The daughter ion at m/e 71 can fragment with
loss of ethene to give the ion at m/e 43.
There are significant peaks at m/e 27 and m/e
41. These peaks result from dehydrogenation of the ions at m/e 29 and m/e 43
respectively. The peak at m/e 41 can also arise from the ion at m/e 57 by loss
of methane.
The most intense peaks in the mass spectrum are
at m/e 43 and m/e 57. The ions responsible for these peaks [C3H7]+
and [C4H9]+ can arise from primary
frag-mentations of the molecular ion itself, as well as from secondary
fragmentations of daughter ions (m/e 99 to m/e 57; m/e 85 to m/e 43; m/e 71 to
m/e 43).
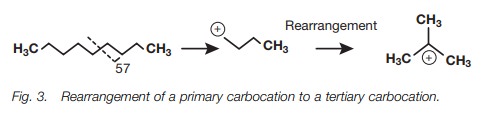
In mass spectroscopy, the ions responsible for
particular peaks are enclosed in square brackets. This is because it is not
really possible to specify the exact struc-ture of an ion or the exact location
of the charge. The ionization conditions used in mass spectroscopy are such
that fragmentation ions can easily rearrange to form structures more capable of
stabilizing the positive charge. For example, the frag-mentation ion at m/e 57
arising from primary fragmentation is a primary carbo-cation, but this can
rearrange to the more stable tertiary carbocation (Fig. 3).
High-resolution mass spectroscopy
The molecular weight is measured by mass spectroscopy and is usually measuredas a whole number with no decimal places. However, it is possible to measure themolecular weight more accurately (high resolution mass spectroscopy) to four decimal places and establish the molecular formula. Consider the molecules CO, N2, CH2N and C2H4.
All of these molecules have the same molecular weight of 28 and in a normal
mass spectrum would produce a molecular ion of that value. In a high-resolution
mass spectrum, the molecular ion is measured to four decimal places and so we
have to consider the accurate atomic
masses of the component atoms. The accurate mass values for the ions are as
follows:
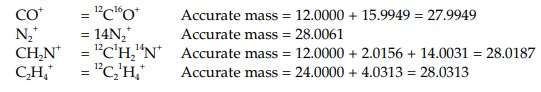
If the measured mass of the molecular ion is
28.0076, this would be in line with the theoretical accurate mass for nitrogen
(i.e. 28.0062). Note that the peak being measured in the mass spectrum is for
the molecular ion. This ion contains the most abundant isotope of all the
elements present. For example, the molecular ion for carbon monoxide is made up
of 12C and 16O only. There are no molecules pre-sent
containing 13C or 17O since these would occur at a higher
position in the mass spectrum. Therefore, the theoretical values for the
molecular weight are calculated using the atomic weights for specific isotopes
and not the accurate atomic weights of the elements as they occur in nature.
The latter (relative atomic weights) take the relative abundances of the
different isotopes into account and will be different in value. For example,
the accurate atomic weight of the carbon isotope 12C is 12.0000 and
this is the value used for calculating the accurate mass of a molecular ion. The accurate relative atomic weight of carbon is higher at
12.011 due to the presence of the isotope 13C.
Related Topics