Chapter: Mechanical and Electrical : Power Plant Engineering : Power Plants and Boilers
Load Duration Curve

LOAD DURATION CURVE
The load demand on a power system
is governed by the consumers and for a system supplying industrial and domestic
consumers, it varies within wide limits. This variation of load can be
considered as daily, weekly, monthly or yearly. Such load curves are termed as
“Chronological load Curves”.
If the ordinates of the
chronological load curves are arranged in the descending order of magnitude
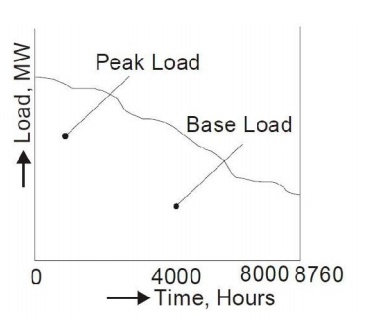
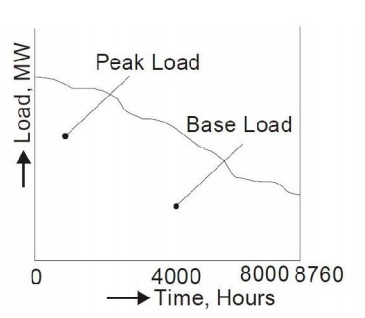
with the highest ordinates on left, a new type of load curve known as “load
duration curve” is
obtained. If any point is taken on this curve then the abscissa of this point
will show the number of hours per year during which the load exceeds the
value denoted by its ordinate.
The lower part of the curve consisting of the loads which are to be supplied for almost the whole number of hours in a year, represents the “Base Load”, while the upperpart, comprising loads which are required for relatively few hours per year, represents the “Peak Load”.

GT-ST
Combined Power plants
It has been found that a considerable
amount of heat energy goes as a waste with the exhaust of the gas turbine. This
energy must be utilized. The complete use of the energy available to a system
is called the total energy approach. The remaining heat (e.g., hot exhaust
fumes) from combustion is generally wasted. Combining two or more thermodynamic
cycle’s results in improved overall efficiency,
reducing fuel costs. In stationary power plants, a successful, common
combination is the Brayton cycle (in the form of a turbine burning
natural gas or synthesis gas from coal) and the Rankine cycle (in the
form of a steam power plant). Multiple stage turbine or steam cylinders are
also common.
Related Topics