Chapter: 11th Botany : Chapter 15 : Plant Growth and Development
Kinetics of plant growth
Kinetics of growth
It is an
analysis of the motion of cells or expansion.
1. Stages in Growth rate
The total period from initial to the final stage of growth is called the grand period of growth. The total growth is plotted against time and ‘S’ shaped sigmoid curve (Grand period curve) is obtained. It consists of four phases (Figure 15.2). They are:
i.
Lag phase
ii.
Log phase
iii.
Decelerating phase
iv.
Maturation phase
i. Lag phase
In this phase new cells are formed from pre-existing cells slowly. It is found in the tip of the stem, root and branches. It is the initial stage of growth. In other words, growth starts from this period (Figure 15.2).
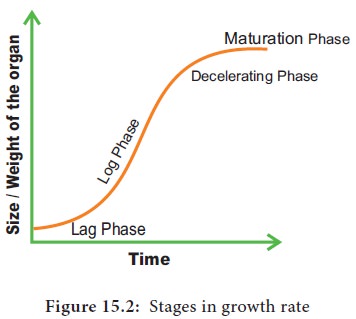
ii. Log phase or exponential growth
Here, the
newly formed cell increases in size rapidly by deposition of cell wall
material. Growth rate is maximum and reaches top because of cell division and
physiological processes are quite fast. The volume of protoplasm also
increases. It results in rapid growth and causes elongation of internode in the
stem.
i.
Decelerating
phase or Decline phase or slow growth phase
The rate
of growth decreases and becomes limited owing to internal and external or both
the factors because the metabolic process becomes slow.
ii.
Steady
state period or maturation phase
In this
phase cell wall thickening due to new particle deposition on the inner surface
of the cell wall takes place. The overall growth ceases and becomes constant.
The growth rate becomes zero.
2. Types of growth rate
The
increased growth per unit time is termed as growth rate. An organism or part of
an organism can produce more cells through arithmetic growth or geometric
growth or both.
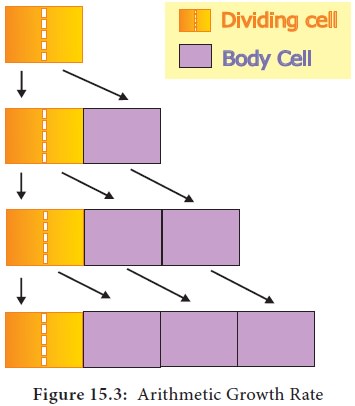
i. Arithmetic Growth Rate
If the
length of a plant organ is plotted against time, it shows a linear curve and
this growth is called arithmetic growth.
·
The rate of growth is constant and it increases in
an arithmetic manner.
·
Only one cell is allowed to divide between the
two-resulting progeny cell.
·
One continues to divide but the other undergoes
cell cycle arrest and begins to develop, differentiate and mature.
·
After each round of cell division, only a single
cell remains capable of division and one new body cell forms.
For
example, starting with a single cell after round 1 of cell division there is
one dividing cell and one body cell. After round 2 there are two body cells,
after round 3 there are three and so on (Figure 15.3).
The plants single dividing cell would undergo one million rounds of nuclear and cellular division. If each round requires one day, this type of arithmetic increase would require one million days or 2739.7 years. This arithmetic rate is capable of producing small number of cells present in very small parts of plants. For example the hair on many leaves and stems consists of just a single row of cells produced by the division of the basal cell, the cell at the bottom of the hair next to other epidermal cells.
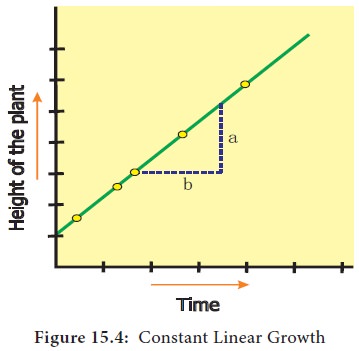
Hair may contain 5 to 10 cells by the division of the
basal cell. So, all its cells could be produced in just five to ten days. In
the figure 15.4, on plotting the hight of the plant against time a linear curve
is obtained. Mathematically it is expressed as:
Lt
= Lo + rt
Lt = length at time ‘t’
Lo = length at time zero
r = growth rate of elongation per unit
ii. Geometric growth rate:
This
growth occurs in many higher plants and plant organs and is measured in size or
weight. In plant growth, geometric cell division results if all cells of an
organism or tissue are active mitotically. Example: Round three in the given
figure 15.5, produces 8 cells as 23 = 8 and after round 20 there are 220
= 1,048,576 cells.
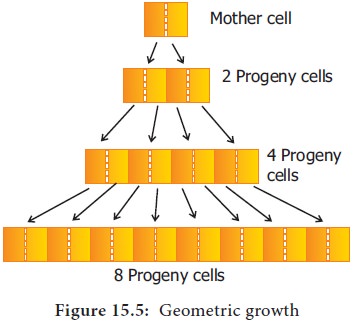
The large
plant or animal parts are produced this way. In fact, it is common in animals
but rare in plants except when they are young and small. Exponential growth
curve can be expressed as,
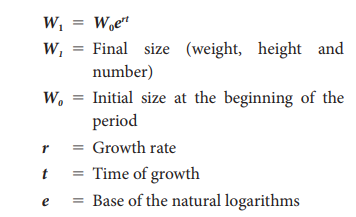
Here ‘r’ is the relative growth rate and also
a measure of the ability of the plant to produce new plant material, referred
to as efficiency index. Hence, the final size of W1 depends on the initial size W0.
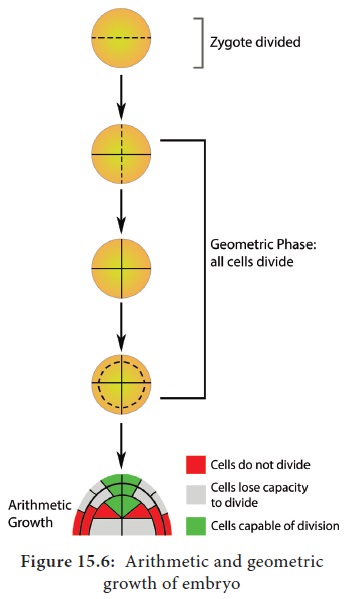
iii. Arithmetic and Geometric Growth of Embryo
Plants
often grow by a combination of arithmetic and geometric growth patterns. A
young embryonic plant grows geometrically and cell division becomes restricted
to certain cells at the tips of roots and shoots. After this point, growth is
of the slower arithmetic type, but some of the new cells that are produced can
develop into their mature condition and begin carrying out specialized types of
metabolism (Figure 15. 6). Plants are thus a mixture of older, mature cells and
young, dividing cells.
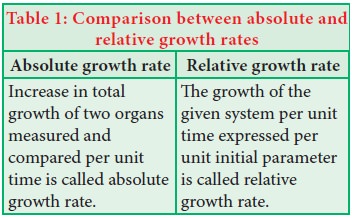
Quantitative
comparisons between the growth of living system can also be made in two ways
and is explained in the table 1.
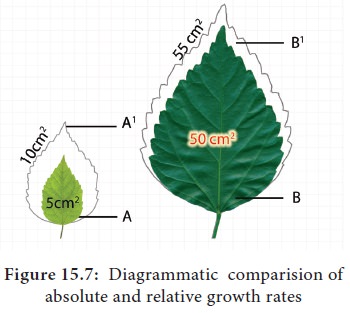
In figure
15.7, two leaves A and B are drawn at a particular time. Then A1and
B1 are drawn after a given time. A and B 5 Area of leaves at a
particular time. A1 and B1 5 Area of leaves after a given
time. (A1-A) and (B1- B) represents an absolute increase
in area in the given time.
Leaf A increases
from 5 cm2 to 10 cm2; 5 cm2 in a given time. Leaf B increases
from 50 cm2 to 55 cm2 ; 5 cm2 in a given time.
Hence, both leaves A and B increase their area by 5 cm2 in a given
time. This is absolute growth. Relative growth is faster in leaf A because of
initial small size. It decreases with time (Figure 15.7).
3.Conditions of growth
Plant
growth is influenced by a variety of external and internal factors. A brief
account of these factors is given below:
I. External Factors
a. Water
Water is
essential for cell enlargement as well as growth in the size of the cell.
Turgidity of cells helps in growth extension. Water provides the medium for
enzymatic activities needed for growth.
b. Nutrition
Nutrition
plays an important role in the formation of protoplasm. Macro and micro
elements are very important as sources of energy. For example, carbon and
oxygen in carbon-di-oxide and hydrogen in water are assimilated in
photosynthesis.
c. Temperature
Temperature
plays a significant role in the growth of the plant. Proper growth of a plant
occurs at a about 28o C to 30o C temperature and above 45o C will damage the
protoplasm and hinders the growth.
d. Oxygen
Oxygen
has a vital role in the growth of the plant. It helps in releasing metabolic
energy essential for growth activities. It is necessary for respiration.
e. Light
Light has
its own contribution in the growth of the plant. Light is important for growth
and photosynthesis. Light stimulates healthy growth. Absence of light may lead
to yellowish in colour. This is called etiolation.
II. Internal Factors
a. Genes are
intracellular factors for growth.
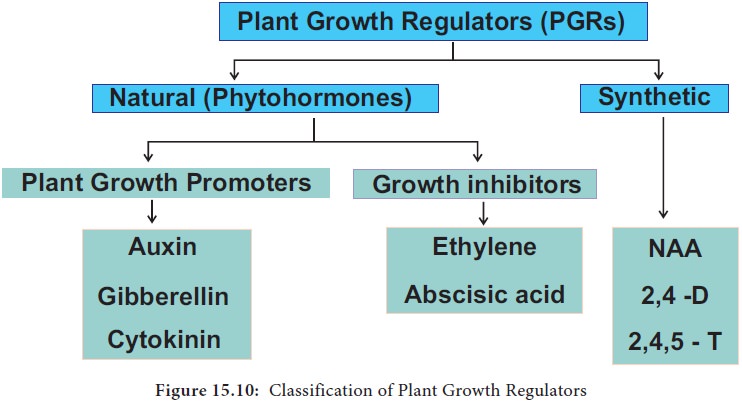
b. Phytohormones
are intracellular factors for growth. Example: auxin, gibberellin, cytokinin.
c. C/N
ratio.
The ratio
of carbohydrates and nitrogenous compounds regulate the specific pattern of growth
in plants. For example, if a plant contains more nitrogenous compounds as
compared to carbohydrates it produces more protoplasm less mechanical tissues
and vigorous vegetative growth. On the other hand, less nitrogenous compounds
and more carbohydrates favour the synthesis of more wall material, less
protoplasm, and more mechanical tissues.
4. Measurement of growth
Activity
Measurement of growth by direct
method.
Step 1: Take ordinary scale.
Step 2: Measure ground stem up to the growing point of the plant.
Step 3: Use Indian ink and mark at regular intervals to measure
the length of root, stem, and girth of the trunk.
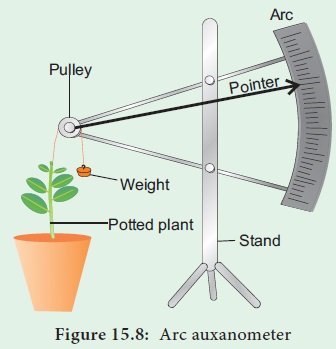
Experiment: 1. Arc auxanometer:
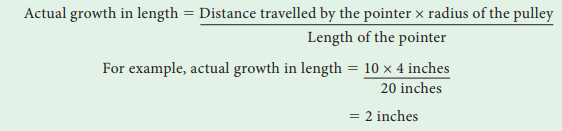
The increase in the length of the stem tip can easily be measured by an arc auxanometer which consists of a small pulley to the axis of which is attached a long pointer sliding over a graduated arc. A thread one end of which is tied to the stem tip and another end to a weight passes over the pulley tightly. As soon as the stem tip increases in length, the pulley moves and the pointer slide over the graduated arc (Figure 15.8). The reading is taken. The actual increase in the length of the stem is then calculated by knowing the length of the pointer and the radius of the pulley. If the radius of the pulley is 4 inches and the length of pointer 20 inches the actual growth is measured as follows:
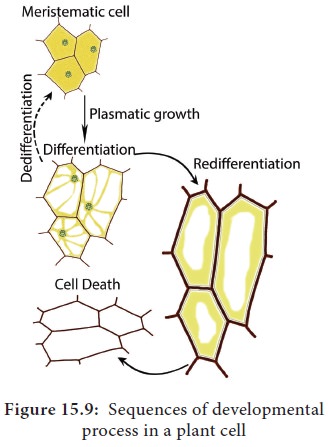
5. Sequence of developmental process in a plant cell
Development
is a term that includes all the changes that an organism goes through during
life cyle from germination of a seed to senescence. Diagrammatic representation
of the sequence of processes which constitute the development of a cell of a
higher plant is given in the figure. It is also applicable to tissues/organ.
1. Differentiation
The
process of maturation of meristematic cells to specific types of cells
performing specific functions is called differentiation.
2. Dedifferentiation
The
living differentiated cells which had lost capacity to divide, regain the
capacity to divide under certain conditions. Hence, dedifferentiation is the
regaining of the ability of cell division by the differentiated cells. Example:
Interfascicular cambium and Vascular cambium.
3. Redifferentiation
Differentiated
cells, after multiplication again lose the ability to divide and mature to
perform specific functions. This is called redifferentiation
(Figure 15.9). Example: Secondary
xylem and Secondary phloem.
4. Plasticity
Plants
follow different pathways in response to environment or phases of life to form
different kinds of structures.
This
ability is called plasticity.
Example: Heterophylly in cotton and coriander. In such plants, the leaves of
the juvenile plant are different in shape from those in mature plants. On the
other hand, the difference in shapes of leaves produced in air and those
produced in water in buttercup also represent the heterophyllous development
due to the environment. This phenomenon of heterophylly is an example of
plasticity.
Related Topics