Chapter: Basic & Clinical Pharmacology : Pharmacokinetics & Pharmacodynamics: Rational Dosing & the Time Course of Drug Action
Interpretation of Drug Concentration Measurements
INTERPRETATION OF DRUG
CONCENTRATION MEASUREMENTS
Clearance
Clearance
is the single most important factor determining drug concentrations. The
interpretation of measurements of drug con-centrations depends on a clear
understanding of three factors that may influence clearance: the dose, the
organ blood flow, and the intrinsic function of the liver or kidneys. Each of
these factors should be considered when interpreting clearance estimated from a
drug concentration measurement. It must also be recognized that changes in
protein binding may lead the unwary to believe there is a change in clearance
when in fact drug elimination is not altered (see Box: Plasma Protein Binding:
Is It Important?). Factors affecting protein binding include the following:
Albumin concentration: Drugs such as phenytoin, salicylates,and disopyramide are extensively bound to plasma albumin. Albumin levels are low in many disease states, resulting in lower total drug concentrations.
Alpha1-acid glycoprotein
concentration: α1-Acid glycopro-tein is an important binding protein with binding
sites for drugs such as quinidine, lidocaine, and propranolol. It is increased
in acute inflammatory disorders and causes major changes in total plasma
concentration of these drugs even though drug elimination is unchanged. Capacity-limited protein binding: The
binding of drugs toplasma proteins is capacity-limited. Therapeutic
concentra-tions of salicylates and prednisolone show concentration-de-pendent
protein binding. Because unbound drug concentration is determined by dosing
rate and clearance—which is not altered, in the case of these
low-extraction-ratio drugs, by pro-tein binding—increases in dosing rate will
cause corresponding changes in the pharmacodynamically important unbound
concentration. In contrast, total drug concentration will increase less rapidly
than the dosing rate would suggest as protein bind-ing approaches saturation at
higher concentrations.
Dosing History
An
accurate dosing history is essential if one is to obtain maxi-mum value from a
drug concentration measurement. In fact, if the dosing history is unknown or
incomplete, a drug concentration measurement loses all predictive value.
Timing of Samples for Concentration Measurement
Information
about the rate and extent of drug absorption in a particular patient is rarely
of great clinical importance. However, absorption usually occurs during the
first 2 hours after a drug dose and varies according to food intake, posture,
and activity. Therefore, it is important to avoid drawing blood until
absorption is complete (about 2 hours after an oral dose). Attempts to mea-sure
peak concentrations early after oral dosing are usually unsuc-cessful and
compromise the validity of the measurement, because one cannot be certain that
absorption is complete.
Some
drugs such as digoxin and lithium take several hours to distribute to tissues.
Digoxin samples should be taken at least 6 hours after the last dose and
lithium just before the next dose (usually 24 hours after the last dose).
Aminoglycosides distribute quite rapidly, but it is still prudent to wait 1
hour after giving the dose before taking a sample.Clearance is readily
estimated from the dosing rate and mean steady-state concentration. Blood
samples should be appropriately timed to estimate steady-state concentration.
Provided steady state has been approached (at least three half-lives of
constant dosing), a sample obtained near the midpoint of the dosing interval
will usually be close to the mean steady-state concentration.
Plasma Protein Binding: Is It Important?
Plasma protein binding is often mentioned as a factor
playing a role in pharmacokinetics, pharmacodynamics, and drug interac-tions.
However, there are no clinically relevant examples of changes in drug
disposition or effects that can be clearly ascribed to changes in plasma
protein binding (Benet & Hoener, 2002). The idea that if a drug is
displaced from plasma proteins it would increase the unbound drug concentration
and increase the drug effect and, perhaps, produce toxicity seems a simple and
obvious mechanism. Unfortunately, this simple theory, which is appropri-ate for
a test tube, does not work in the body, which is an open system capable of
eliminating unbound drug.
First, a seemingly dramatic change in the unbound
fraction from 1% to 10% releases less than 5% of the total amount of drug in
the body into the unbound pool because less than one third of the drug in the
body is bound to plasma proteins even in the most extreme cases, eg, warfarin.
Drug displaced from plasma protein will of course distribute throughout the
volume of distribution, so that a 5% increase in the amount of unbound drug in
the body produces at most a 5% increase in pharmacologically active unbound
drug at the site of action.
Second, when the amount of unbound drug in plasma
increases, the rate of elimination will increase (if unbound clear-ance is
unchanged), and after four half-lives the unbound con-centration will return to
its previous steady-state value. When drug interactions associated with protein
binding displacement and clinically important effects have been studied, it has
been found that the displacing drug is also an inhibitor of clearance, and it
is the change in clearance of the unbound drug that is the relevant
mechanism explaining the interaction.
The clinical importance of plasma protein binding is
only to help interpretation of measured drug concentrations. When plasma
proteins are lower than normal, then total drug concen-trations will be lower
but unbound concentrations will not be affected.
Initial Predictions of Volume of Distribution & Clearance
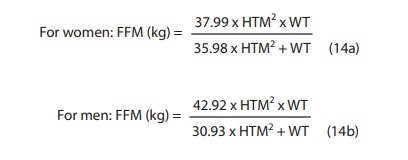
A. Volume of Distribution
Volume
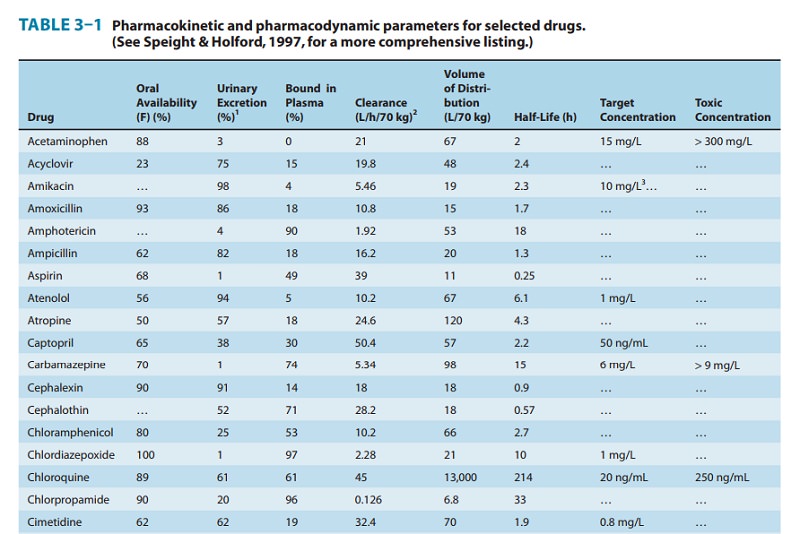
of distribution is commonly calculated for a particular patient using body
weight (70-kg body weight is assumed for the values in Table 3–1). If a patient
is obese, drugs that do not read-ily penetrate fat (eg, gentamicin and digoxin)
should have their volumes calculated from fat-free mass (FFM) as shown below.
Total body weight (WT) is in kilograms and height (HTM) is in meters:
Patients
with edema, ascites, or pleural effusions offer a larger volume of distribution
to the aminoglycoside antibiotics (eg, gen-tamicin) than is predicted by body
weight. In such patients, the weight should be corrected as follows: Subtract
an estimate of the weight of the excess fluid accumulation from the measured
weight. Use the resultant “normal” body weight to calculate the normal volume
of distribution. Finally, this normal volume should be increased by 1 L for
each estimated kilogram of excess fluid. This correction is important because
of the relatively small volumes of distribution of these water-soluble drugs.
B. Clearance
Drugs
cleared by the renal route often require adjustment of clear-ance in proportion
to renal function. This can be conveniently estimated from the creatinine
clearance, calculated from a single serum creatinine measurement and the
predicted creatinine pro-duction rate.
The
predicted creatinine production rate in women is 85% of the calculated value,
because they have a smaller muscle mass per kilogram and it is muscle mass that
determines creatinine pro-duction. Muscle mass as a fraction of body weight
decreases with age, which is why age appears in the Cockcroft-Gault equation.
Revising Individual Estimates of Volume of Distribution & Clearance
The
commonsense approach to the interpretation of drug concen-trations compares
predictions of pharmacokinetic parameters and expected concentrations to
measured values. If measured concen-trations differ by more than 20% from
predicted values, revised estimates of V or CL for that patient should be
calculated using equation (1) or equation (2). If the change calculated is more
than a 100% increase or 50% decrease in either V or CL, the assump-tions made
about the timing of the sample and the dosing history should be critically
examined. For example, if a patient is taking 0.25 mg of digoxin a day, a
clinician may expect the digoxin concentration to be about 1 ng/ mL. This is
based on typical values for bioavailability of 70% and total clearance of about
7 L/h (CLrenal 4 L/h, CLnonrenal 3 L/h). If the patient
has heart failure, the nonrenal (hepatic) clearance might be halved because of
hepatic congestion and hypoxia, so the expected clearance would become 5.5 L/h.
The concentration is then expected to be about 1.3 ng/mL. Suppose that the
concentra-tion actually measured is 2 ng/mL. Common sense would suggest halving
the daily dose to achieve a target concentration of 1 ng/mL. This approach
implies a revised clearance of 3.5 L/h. The smaller clearance compared with the
expected value of 5.5 L/h may reflect additional renal functional impairment
due to heart failure.This technique will often be misleading if steady state
has not been reached. At least a week of regular dosing (three to four half-lives)
must elapse before the implicit method will be reliable.
Related Topics