Chapter: Problem Solving and Python Programming : Algorithmic Problem Solving
Guidelines For Drawing a Flowchart
GUIDELINES FOR DRAWING A FLOWCHART
Flowcharts are usually drawn using some standard symbols; however, some special
symbols can also be developed hen required. Some standard symbols, which are
frequently required for flowcharting many computer programs.
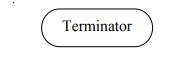
Terminator:
An oval
flow chart shape indicates the start or end of the process, usually containing
the ord “Start” or “End”.
Process:
A
rectangular flow chart shape indicates a normal/generic process flow step. For
example, “Add 1 to X”, “M = M*F” or similar.

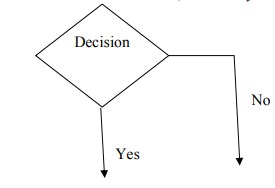
Decision:
A diamond
flow chart shape indicates a branch in the process flow. This symbol is used
when a decision needs to be made, commonly a Yes/No question or True/False
test.
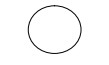
Connector:
A small,
labelled, circular flow chart shape used to indicate a jump in the process
flow.
Connectors
are generally used in complex or multi-sheet diagrams.
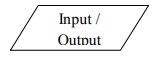
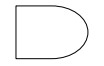
Data:
A
parallelogram that indicates data input or output(I/O)for a process. Examples:
Get X from the user, Display X.
Delay:
Used to
indicate a del y or w it in the process for input from some other process.
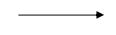
Arrow:
Used to
show the flow of control in process. An arrow coming from one symbol and ending
at another symbol represents that control passes to the symbol the arrow points
to.
Basic Flowchart
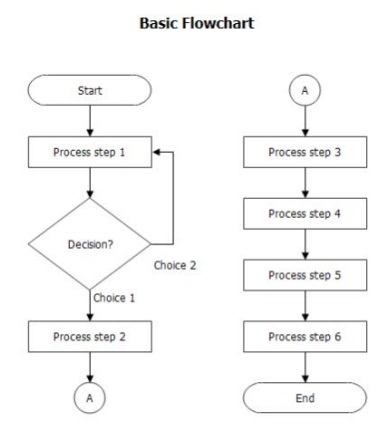
These are
the basic symbols used generally. Now, the basic guidelines for drawing a
flowchart with the above symbols are that:
·
In drawing a proper flowchart, all necessary
requirements should be listed out in logical order.
·
The flowchart should be ne t, clear and easy to
follow. There should not be any room for ambiguity in understanding the
flowchart.
·
The flowchart is to be read left to right or top to
bottom.
·
A process symbol can have only one flow line coming
out of it.
·
For a decision symbol, only one flow line can enter
it, but multiple lines can leave it to denote possible answers.
· The terminal symbols can only have one flow line in conjunction with them.
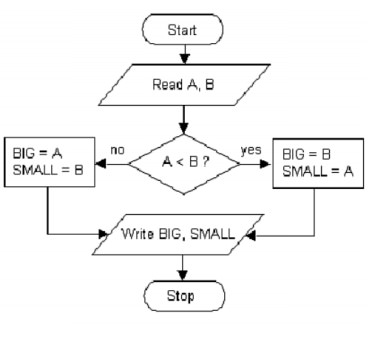
Example Flowchart
Problem
1: Draw the flowchart to find the largest number between A and B
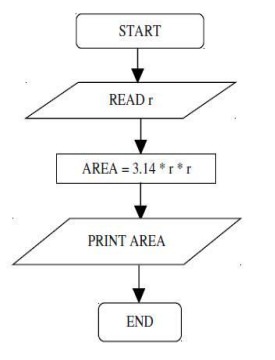
Problem 2: Find
the area of circle of radius r.
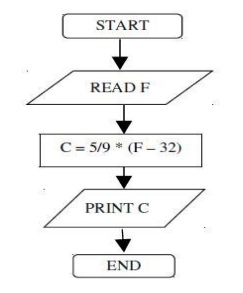
Problem 3: Convert
temperature Fahrenheit to Celsius.
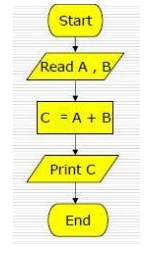
Problem 4:
Flowchart for an algorithm which g ts two numbers and prints sum of their value
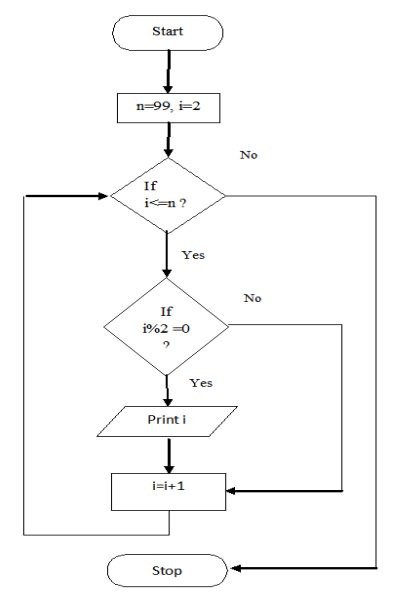
Problem5:
Flowchart for the problem of printing even numbers between 0 and 99.
Related Topics