Chapter: Microbiology and Immunology: Morphology and Physiology of Bacteria
Growth and Multiplication of Bacteria
Growth and Multiplication of Bacteria
Bacterial growth can be defined as an orderly increase of all the
chemical components of the cell. Cell multiplication is a con-sequence of
growth that leads to an increase in the number of bacteria making up a
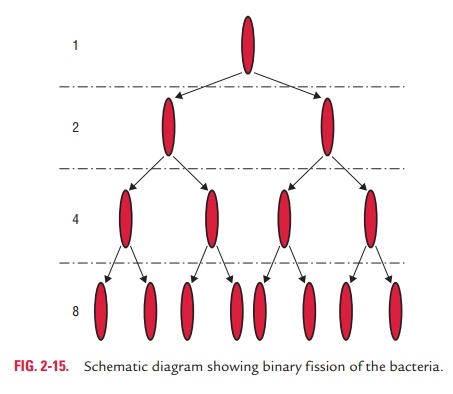
population or culture. Most bacteria divide by binary fission in which the
bacteria undergo cell division to produce two daughter cells identical to the
parent cell. Bacterial growth can be equated to cell number: one bacterium
divides into two, these two produce four, and then eight, and so on (Fig.
2-15). The growth rate of a bacterium is therefore measured by measuring the
change in bacterial number per unit time.
Generation Time
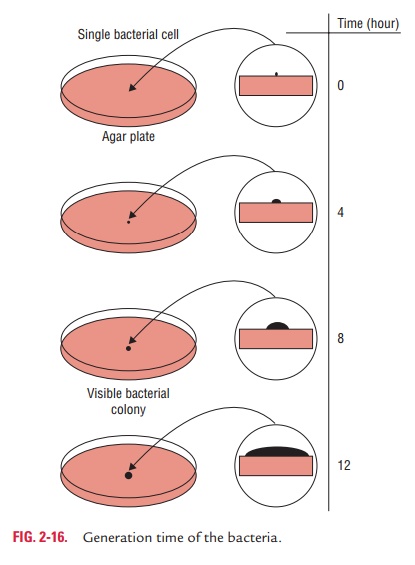
Generation time is the time required for a bacterium to give rise
to two daughter cells under optimum conditions. The generation time for most of
the pathogenic bacteria, such as E. coli,
is about 20 minutes. The generation time is longer (i.e.,20 hours) for M. tuberculosis and longest (i.e., 20
days) for M.leprae. A bacterium
replicates and multiplies rapidly producingmillions of cells within 24 hours.
For example, E. coli in about 7 hours
can undergo 20 generations and produce 1 million cells, in about 10 hours
undergo 30 generations and produce 1 billion cells, and in 24 hours produces 1021
cells (Fig. 2-16). However, in actual practice, the multiplication of bacteria
is arrested after a few cell divisions due to exhaustion of nutrients and
accumulation of toxic products.
Bacterial Count
Microbial concentrations can be measured in terms of (i) cell concentration (the number of
viable cells per unit volume of culture) or (ii) biomass concentration (dry weight of cells per unit volume of
culture). The number of bacteria at a given time can be estimated by performing
a total count or viable count.
Total count: This denotes the total number
of bacteria in thesample, irrespective of whether they are living or dead. This
is done by counting the bacteria under the microscope using counting chamber or
by comparing the growth with standard opacity tubes.
Viable count: This usually indicates the
number of livingor viable bacteria. This count can be obtained by dilution or
plating method.
In dilution method, several tubes with
liquid culture media are incubated with varying dilutions of sample and the
viable count is calculated from the number of tubes showing bacterial growth.
This method is widely used in
In the plate method, a sample is diluted and small volume of it is
spread on the surface of an agar plate. The number of colonies that grow after
a suitable incubation time indicates viable count of the bacteria.
Bacterial Growth Curve
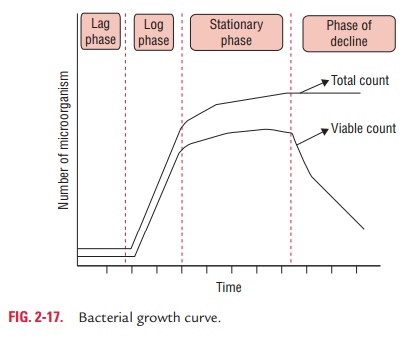
When a broth culture is inoculated with a small bacterial
inocu-lum, the population size of the bacteria increases showing a clas-sical
pattern. The bacterial growth curve shows the following four distinct phases
(Fig. 2-17):
1. Lag phase: After a
liquid culture broth is inoculated, themultiplication of bacteria does not
start immediately. It takes some time to multiply. The time between inoculation
and beginning of multiplication is known as lag phase. In this phase, the
inoculated bacteria become acclimatized to the environment, switch on various
enzymes, and adjust to the environmental temperature and atmospheric
conditions. During this phase, there is an increase in size of bacteria but no
appreciable increase in number of bacterial cells. The cells are active
metabolically. The duration of the lag phase varies with the bacterial species,
nature of culture medium, incubation temperature, etc. It may vary from 1 hour
to several days.
2. Log phase: This phase is characterized by rapid
exponentialcell growth (i.e., 1 to 2 to 4 to 8 and so on). The bacterial
population
doubles during every generation. They multiply at their maximum rate. The
bacterial cells are small and uniformly stained. The microbes are sensitive to
adverse conditions, such as antibiotics and other antimicrobial agents.
3. Stationary phase: After log phase, the
bacterial growth almoststops completely due to lack of essential nutrients,
lack of water oxygen, change in pH of the medium, etc. and accumulation of
their own toxic metabolic wastes. Death rate of bacteria exceeds the rate of
replication of bacteria. Endospores start forming dur-ing this stage. Bacteria
become Gram variable and show irregular staining. Many bacteria start producing
exotoxins.
4. Decline phase: During this phase, the bacterial
populationdeclines due to death of cells. The decline phase starts due to (a) accumulation of toxic products and
autolytic enzymes and (b) exhaustion
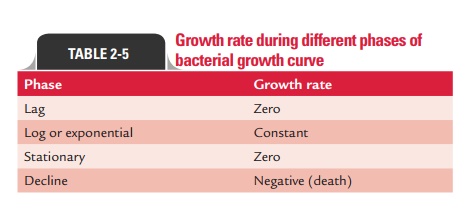
of nutrients. Involution forms are common in this stage. Growth rate during
different phases of bacterial growth curve is summarized in Table 2-5.
The continuous culture is a method of culture useful for industrial
and research purpose. This is achieved by using a special device for
replenishing nutrients and removing bacte-rial population continuously so that
bacteria growth is not inhibited due to lack of nutrients or due to
accumulation of toxic bacterial metabolites.
Factors Affecting Growth of Bacteria
A variety of factors affect growth of bacteria. These are discussed
below:
◗
Oxygen
Bacteria on the basis of their oxygen requirements can be
classi-fied broadly into aerobic and anaerobic bacteria.
Aerobic bacteria: They require oxygen for their
growth. Theymay be:
o Obligate aerobes—which can
grow only in the presence of oxygen (e.g., P.
aeruginosa).
o Facultative aerobes—which are
ordinary aerobes but can also grow without oxygen (e.g., E. coli). Most of the pathogenic bacteria are facultative aerobes.
o Microaerophilic
bacteria—those bacteria that can grow in the presence of low oxygen and in the
presence of low (4%) concentration of carbon dioxide (e.g., Campylobacter jejuni).
Some fermentative organisms (e.g., Lactobacillus plantarum) are aerotolerant but do not contain the
enzyme catalase or superoxide dismutase. Oxygen is not reduced, and therefore
hydrogen peroxide (H2O2) and nascent oxygen (O22) are not produced.
Anaerobic
bacteria: Obligate anaerobes are the bacteria thatcan
grow only in the absence of oxygen (e.g., Clostridium
botulinumClostridium tetani, etc.). These
bacteria lack superoxide dismutaseand catalase; hence oxygen is lethal to these
organisms.
◗
Carbon dioxide
The organisms that require higher amounts of carbon dioxide (CO2)
for their growth are called capnophilic bacteria. They grow well in the
presence of 5–10% CO2 and 15% O2. In candle jar, 3% CO2
can be achieved. Examples of such bacteria include H. influenzae, Brucellaabortus, etc.
◗
Temperature
The optimum temperature for most of the pathogenic bacteria is 378C. The optimal temperature,
however, is variable; depend-ing on their temperature range, growth of bacteria
is grouped as follows:
o Psychrophiles:These bacteria are cold loving microbes thatgrow within a
temperature range of 0–208C. Most of soil and water saprophytes belong to this group.
o Mesophiles:These are moderate temperature loving microbesthat grow between 258C and 408C. Most of pathogenic
bac-teriabelong to this group.
o Thermophiles:These are heat loving microbes. They can growat a high temperature
range of 55–808C. B. stearothermophilus
is an example.
◗pH
Most pathogenic bacteria grow between pH 7.2 and 7.6. Very few
bacteria, such as lactobacilli, can
grow at acidic pH below 4.0. Many food items, such as pickles and cheese, are
prevented from spoilage by acids produced during fermentation.
V. choleraeis an example of the bacteria
that can grow at analkaline (8.2–8.9) pH.
◗ Light
Depending on the source of energy bacteria make use of, they may be
classified as phototrophs (bacteria deriving energy from sunlight) or
chemotrophs (bacteria deriving energy from chem-ical sources).
◗
Osmotic pressure
Microbes obtain almost all their nutrients in solution from
surrounding water. Hence factors such as osmotic pressure and salt
concentration of the solution affect the growth of bacteria. Bacteria by virtue
of mechanical strength of their cell wall are able to withstand a wide range of
external osmotic variations. Organisms requiring high osmotic pressures are
called osmo-philic bacteria. Sudden exposure of bacteria to hypertonic
solu-tion may cause osmotic withdrawal of water, leading to osmotic shrinkage of
the protoplasm ( plasmolysis). On the other hand, sudden transfer of bacteria
from concentrated solution to dis-tilled water may cause excessive imbibition
of water leading to swelling and bursting of cell ( plasmoptysis).
Related Topics