Chapter: Essentials of Anatomy and Physiology: Heart
Electrical Activity of the Heart
ELECTRICAL ACTIVITY OFTHE HEART
ACTION POTENTIALS IN CARDIAC MUSCLE
Like action potentials in skeletal muscle and neurons, those in car-diac muscle exhibit depolarization followed by repolarization. In cardiac muscle, however, a period of slow repolarization greatly pro-longs the action potential (figure 12.14). In contrast to action poten-tials in skeletal muscle, which take less than 2 milliseconds (ms) to complete, action potentials in cardiac muscle take approximately 200 to 500 ms to complete. In addition, unlike in skeletal muscle, action potentials in cardiac muscle are conducted from cell to cell.
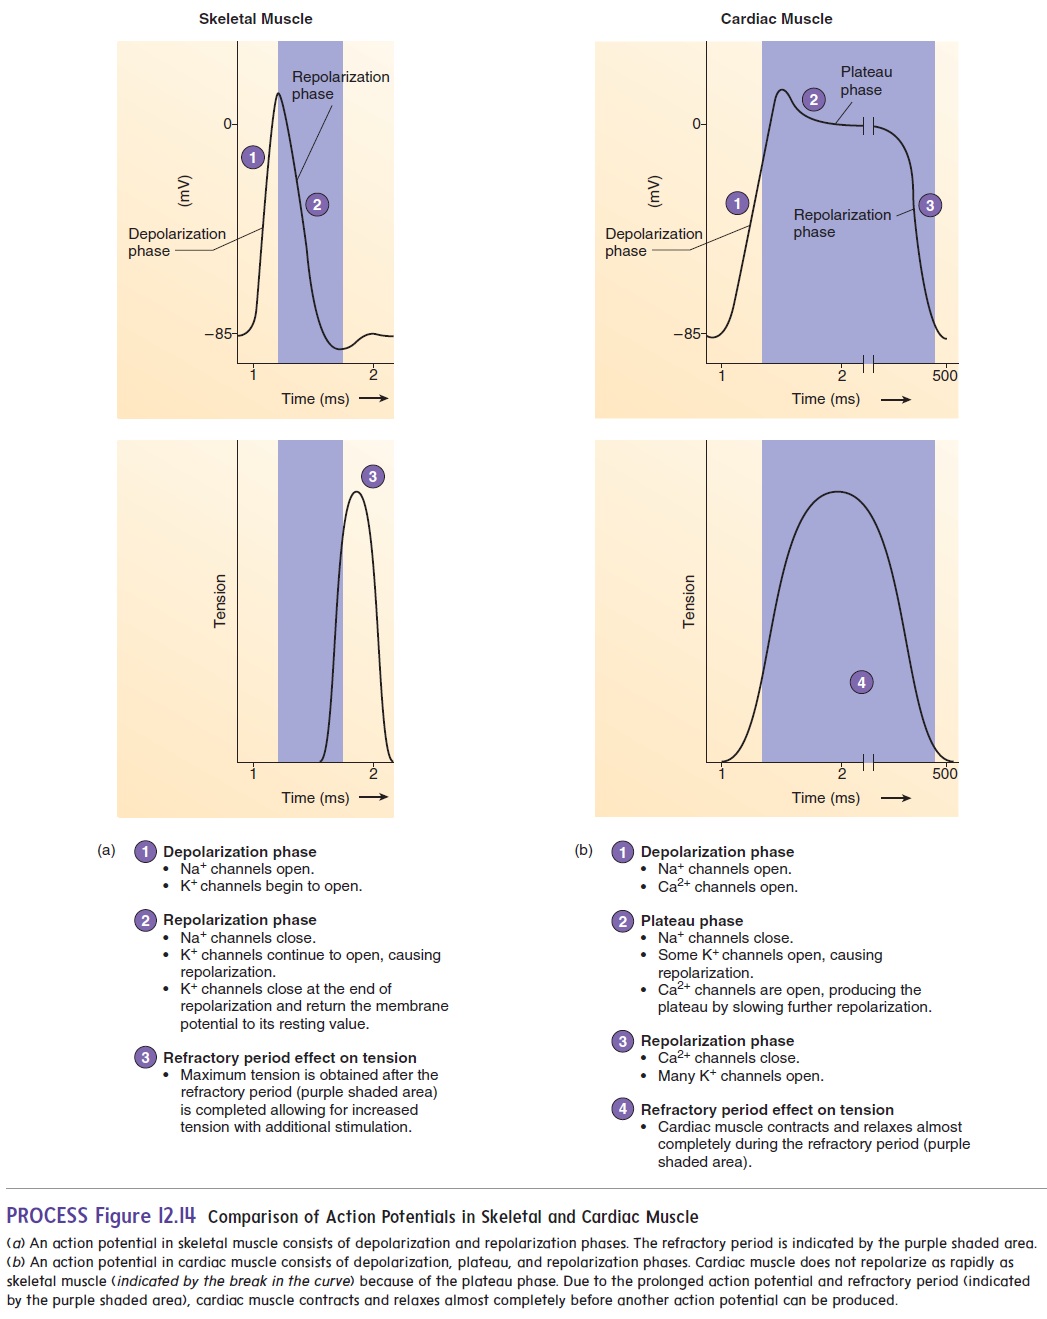
In cardiac muscle, each action potential consists of a depolar-ization phase followed by a period of slow repolarization called the plateau phase. At the end of the plateau phase, a rapid repolar-ization phase takes place. During the final repolarization phase, themembrane potential achieves its maximum degree of repolarization (figure 12.14b) and returns to the resting membrane potential.
The opening and closing of membrane channels is responsi-ble for the changes in the permeability of the cell membrane that produce action potentials . The initial, rapid depo-larization phase of the action potential results from the opening of voltage-gated Na+ channels, which increases the permeability of the cell membrane to Na+. Sodium ions then diffuse into the cell, causing depolarization. This depolarization stimulates the open-ing of voltage-gated Ca2+ channels, and Ca2+ begins diffusing into the cell, contributing to the overall depolarization. At the peak of depolarization, the Na+ channels close, and a small number of K+ channels open. However, the Ca2+ channels remain open. Thus, the exit of K+ from the cell is counteracted by the continued movement of Ca2+ into the cell. Consequently, the plateau phase is primarily the result of the opening of voltage-regulated Ca2+ channels. The slow diffusion of Ca2+ into the cell is the reason the cardiac muscle fiber action potential lasts longer than the action potentials in skeletal muscle fibers. The plateau phase ends, and the repolarization phase begins as the Ca2+ channels close and many K+ channels open, allowing K+ to move out of the cell.
Action potentials in cardiac muscle exhibit a refractory period, like that of action potentials in skeletal muscle and in neurons. The refractory period lasts about as long as the plateau phase of the action potential in cardiac muscle. The prolonged action potential and refractory period allow cardiac muscle to contract and relax almost completely before another action potential can be produced. Also, the long refractory period in cardiac muscle prevents tetanic contractions from occurring, thus ensuring a rhythm of contraction and relaxation for cardiac muscle. Therefore, action potentials in cardiac muscle are different from those in skeletal muscle because the plateau phase makes the action potential and its refractory period last longer.
Conduction System Of The Heart
Unlike skeletal muscle that requires neural stimulation to con-tract, cardiac muscle can contract without neural stimulations. Contraction of the atria and ventricles is coordinated by special-ized cardiac muscle cells in the heart wall that form the conductionsystem of the heart (figure 12.15).
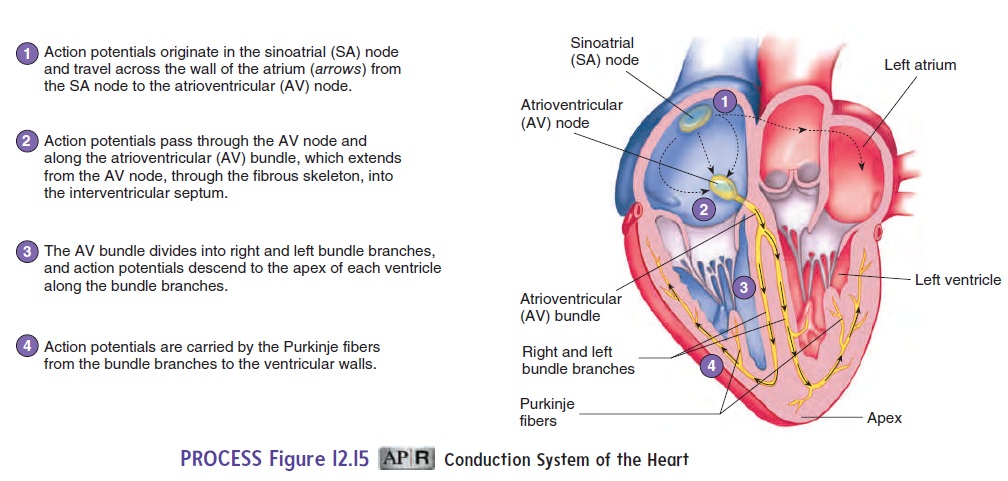
All the cells of the conduction system can produce spon-taneous action potentials. The sinoatrial node, atrioventricular node, atrioventricular bundle, right and left bundle branches, and Purkinje fibers constitute the conduction system of the heart. The sinoatrial (SA) node, which functions as the heart’s pacemaker,is located in the superior wall of the right atrium and initiates the contraction of the heart. Action potentials originate in the SA node and spread over the right and left atria, causing them to contract. The SA node produces action potentials at a faster rate than other areas of the heart and has a larger number of Ca2+ channels tha other cells in the heart. In addition, the Na+ and Ca2+ channels in the SA node spontaneously open and close at a rhythmic rate.
The heart rate can be affected by certain drugs. Calcium channel blocking agents, for example, are drugs that slow the heart by decreasing the rate of action potential production in the SA node. Calcium channel blockers decrease the rate at which Ca2+ moves through Ca2+ chan-nels. As a result, it takes longer for depolarization to reach thresh-old, and the interval between action potentials increases.
A second area of the heart, the atrioventricular (AV) (̄a -tr̄e - ̄o -ven′trik′-̄u ′l̆a r)node,is located in the lower portion of the rightatrium. When action potentials reach the AV node, they spread slowly through it and then into a bundle of specialized cardiac muscle called the atrioventricular (AV) bundle. The slow rate of action potential conduction in the AV node allows the atria to complete their contraction before action potentials are delivered to the ventricles.
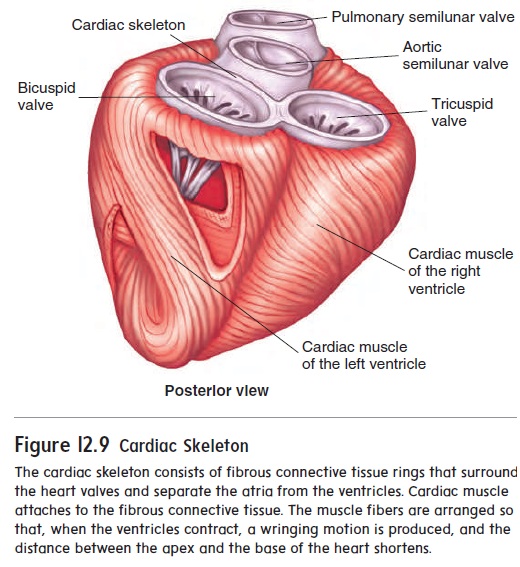
After action potentials pass through the AV node, they are rapidly transmitted through the AV bundle, which projects through the fibrous connective tissue plate that separates the atria from the ventricles (see figure 12.9). The AV bundle thendivides into two branches of conducting tissue, called the left and right bundle branches (figure 12.15). At the tips of the left andright bundle branches, the conducting tissue forms many small bundles of Purkinje (p̆u r-k n′ j̄e ) fibers. The Purkinje fibers pass to the apex of the heart and then extend to the cardiac muscle of the ventricle walls. The AV bundle, the bundle branches, and the Purkinje fibers are composed of specialized cardiac muscle fibers that conduct action potentials more rapidly than do other cardiac muscle fibers. Consequently, action potentials are rapidly deliv-ered to all the cardiac muscle of the ventricles. The coordinated contraction of the ventricles depends on the conduction of action potentials by the conduction system
Following their contraction, the ventricles begin to relax. After the ventricles have completely relaxed, another action potential originates in the SA node to begin the next cycle of contractions.
The SA node is the pacemaker of the heart, but other cells of the conduction system are also capable of producing action poten-tials spontaneously. For example, if the SA node is unable to func-tion, another area, such as the AV node, becomes the pacemaker. The resulting heart rate is much slower than normal. When action potentials originate in an area of the heart other than the SA node, the result is called anectopic (ek-top′ ik) beat.
Electrocardiogram
Action potentials conducted through the heart during the cardiac cycle produce electrical currents that can be measured at the surface of the body. Electrodes placed on the body surface and attached to a recording device can detect the small electrical changes resulting from the action potentials in all of the cardiac muscle cells. Therecord of these electrical events is an electrocardiogram (̄e -lek-tr̄o - kar′ d̄e -̄o-gram; ECG or EKG) (figure 12.16).
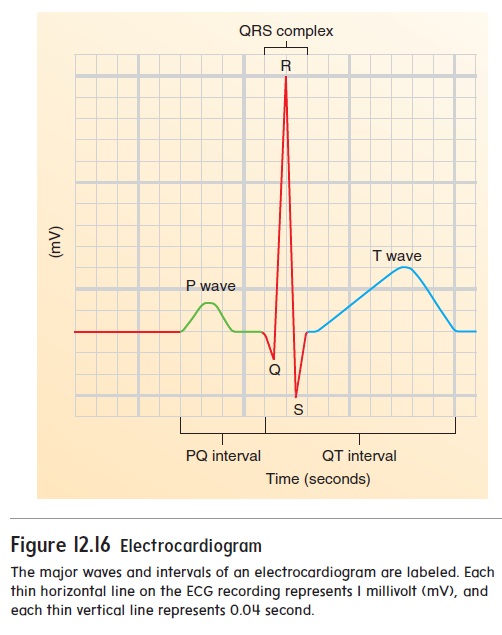
The normal ECG consists of a P wave, a QRS complex, and a T wave. The P wave results from depolarization of the atrial myocardium, and the beginning of the P wave precedes the onset of atrial contraction. The QRS complex consists of three individual waves: the Q, R, and S waves. The QRS complex results from depo-larization of the ventricles, and the beginning of the QRS complex precedes ventricular contraction. The T wave represents repolariza-tion of the ventricles, and the beginning of the T wave precedes ventricular relaxation. A wave representing repolarization of the atria cannot be seen because it occurs during the QRS complex.
The time between the beginning of the P wave and the begin-ning of the QRS complex is the PQ interval, commonly called the PR interval because the Q wave is very small. During the PQ interval, the atria contract and begin to relax. At the end of the PQ interval, the ventricles begin to depolarize.
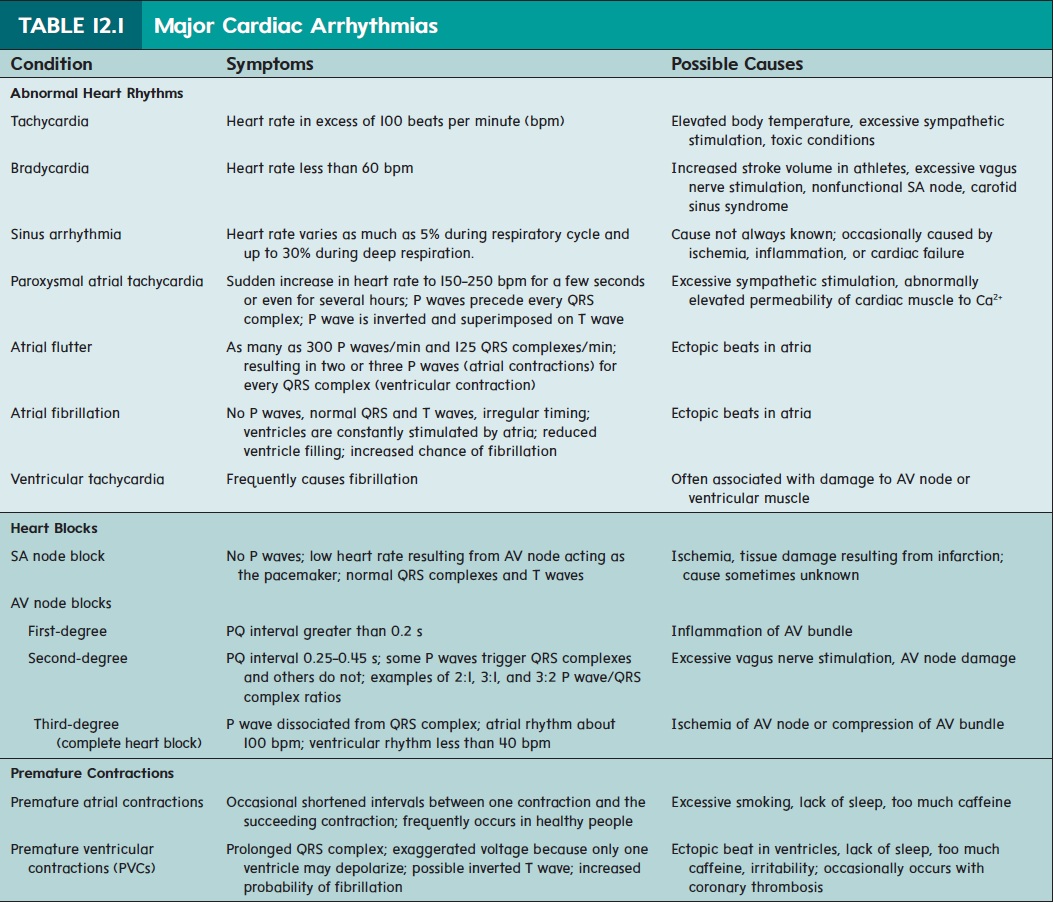
The QT interval extends from the beginning of the QRS complex to the end of the T wave and represents the length of time required for ventricular depolarization and repolarization. Table 12.1 describes several conditions associated with abnormal heart rhythms.
The ECG is not a direct measurement of mechanical events in the heart, and neither the force of contraction nor the blood pressure can be determined from it. However, each deflection in the ECG record indicates an electrical event within the heart and correlates with a subsequent mechanical event. Consequently, the ECG is an extremely valuable tool for diagnosing a number of cardiac abnormalities, particularly because it is painless, easy to record, and nonsurgical. Analysis of an ECG can reveal abnormal heart rates or rhythms; problems in conduction pathways, such as blockages; hypertrophy or atrophy of portions of the heart; and the approximate location of damaged cardiac muscle.
Related Topics