Chapter: Essentials of Anatomy and Physiology: Heart
Cardiac Cycle

CARDIAC CYCLE
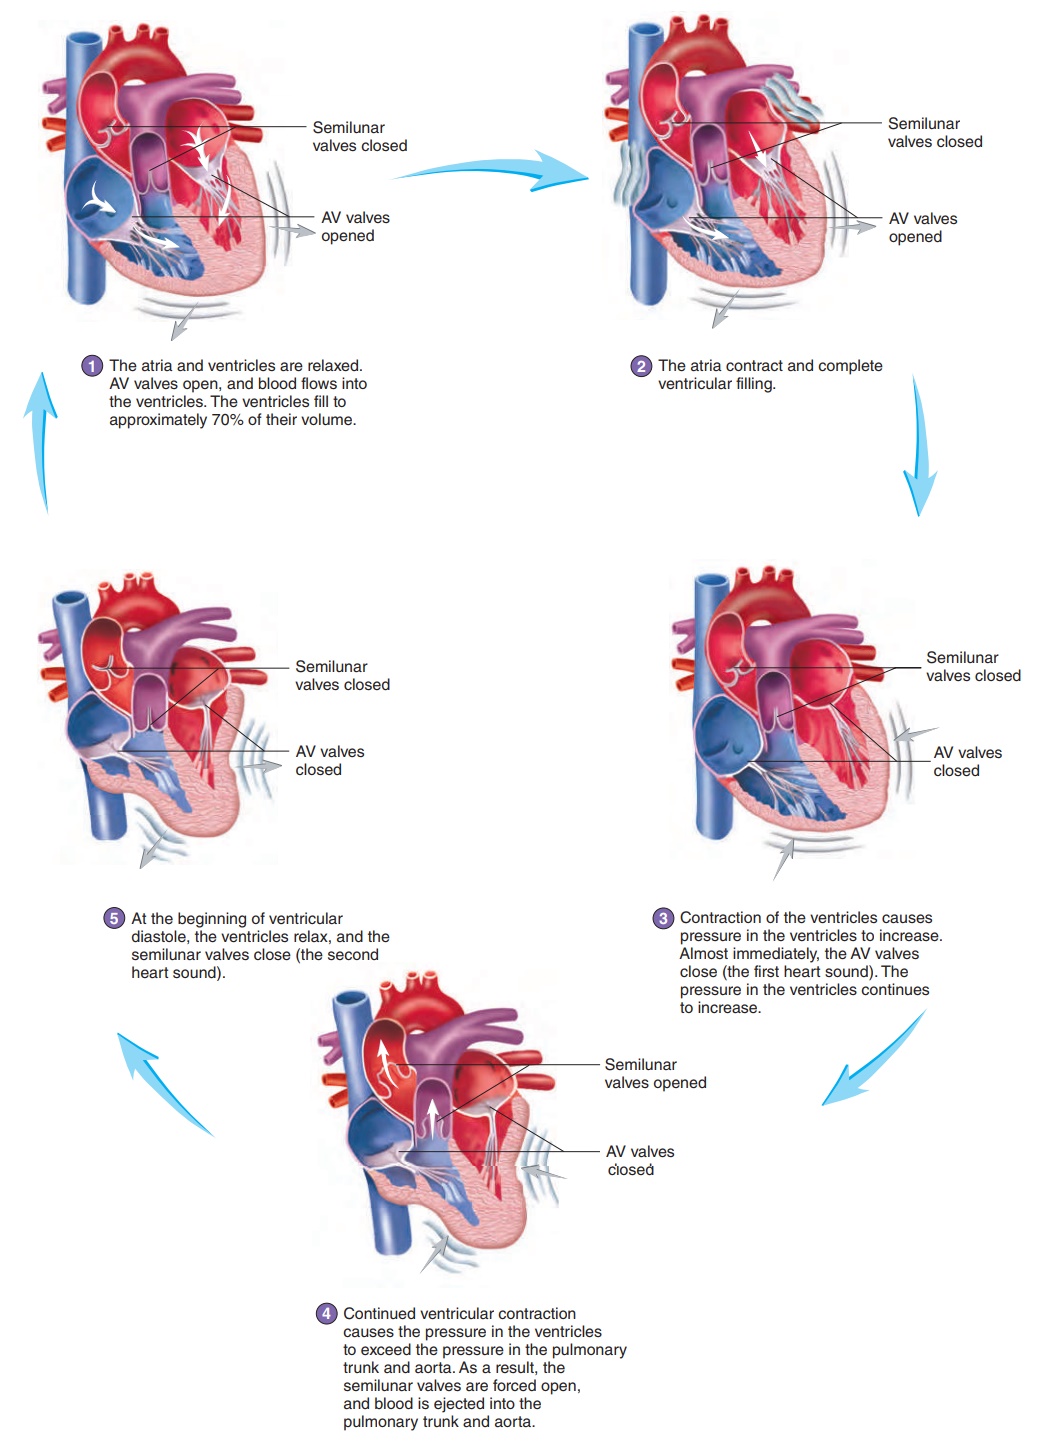
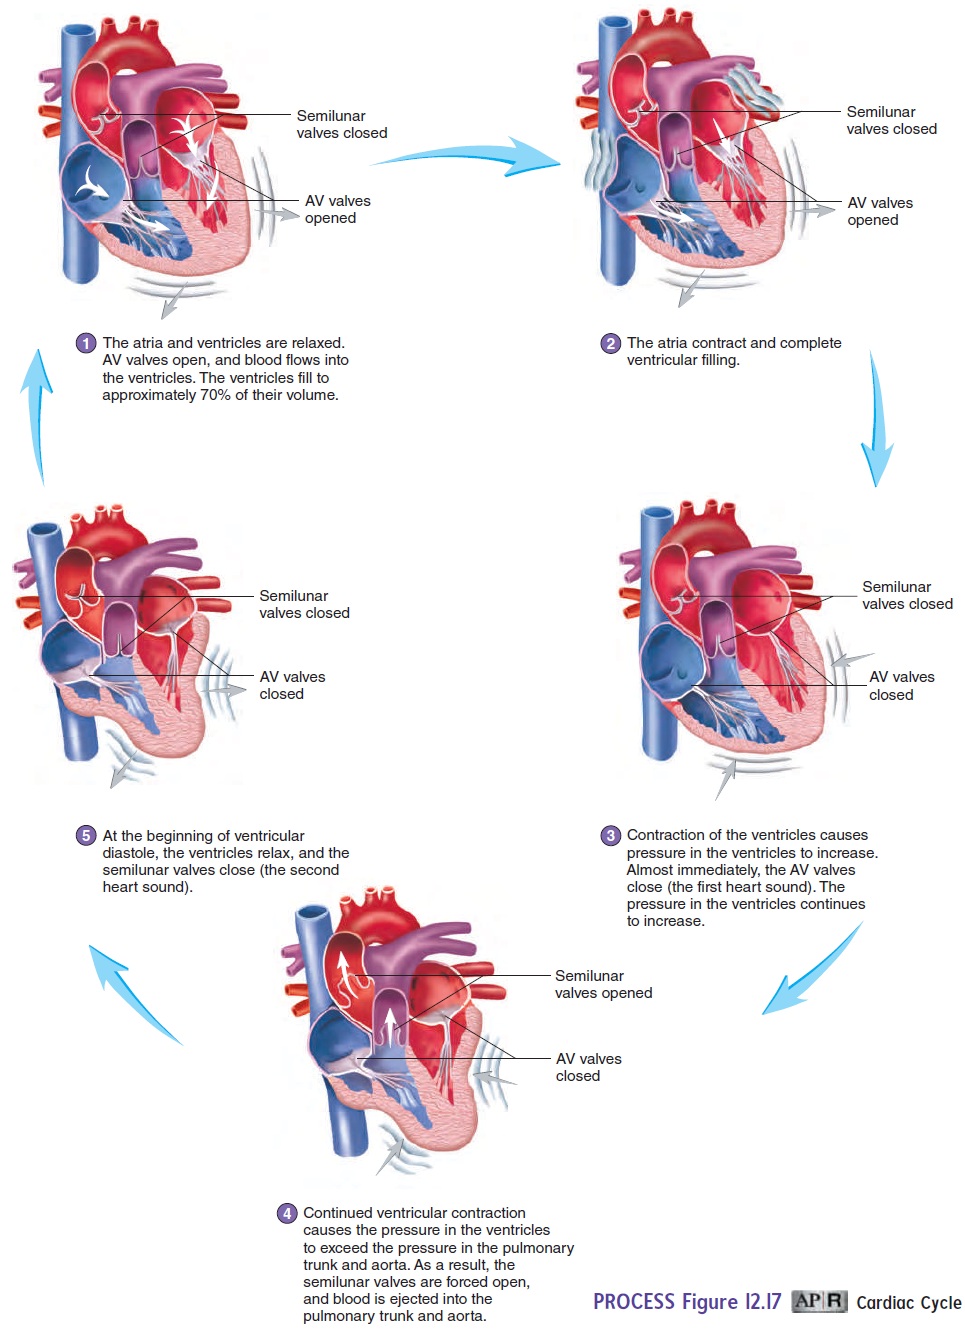
The right and left halves of the heart can be viewed as two separate pumps. Each pump consists of a primer pump—the atrium—and a power pump—the ventricle. The atria act as primer pumps because they complete the filling of the ventricles with blood, and the ventricles act as power pumps because they produce the major force that causes blood to flow through the pulmonary and systemic circulations. The term cardiac cycle refers to the repeti-tive pumping process that begins with the onset of cardiac muscle contraction and ends with the beginning of the next contraction (figure 12.17). Pressure changes produced within the heart chambers as a result of cardiac muscle contraction move blood from areas of higher pressure to areas of lower pressure.
Atrial systole (sis′tō-lē; a contracting) refers to contraction ofthe two atria. Ventricular systole refers to contraction of the two ventricles. Atrial diastole (dı̄-as′ tō-lē; dilation) refers to relax-ation of the two atria, and ventricular diastole refers to relaxation of the two ventricles. When the terms systole and diastole are used alone, they refer to ventricular contraction or relaxation. The ventricles contain more cardiac muscle than the atria and produce far greater pressures, which force blood to circulate throughout the vessels of the body.

During the cardiac cycle, changes in chamber pressure and the opening and closing of the heart valves determine the direction of blood movement. As the cardiac cycle is described, it is important to focus on these pressure changes and heart valve movements. Before we start, it is also important to have a clear image of the state of the heart. At the beginning of the cardiac cycle, the atria and ventricles are relaxed, the AV valves are open, and the semilunar valves are closed. Blood returning to the heart first enters the atria. Since the AV valves are open, blood flows into the ventricles, filling them to approximately 70% of their volume (figure 12.17, step 1). The major events of the cardiac cycle are as follows:
· Atrial systole—The atria contract, forcing additionalblood to flow into the ventricles to complete their filling (figure 12.17, step 2). The semilunar valves remain closed.
· Ventricular systole—At the beginning of ventricularsystole, contraction of the ventricles pushes blood toward the atria, causing the AV valves to close as the pressure begins to increase (figure 12.17, step 3).
· As ventricular systole continues, the increasing pressure in the ventricles exceeds the pressure in the pulmonary trunk and aorta, the semilunar valves are forced open, and blood is ejected into the pulmonary trunk and aorta (figure 12.17, step 4).
· Ventricular diastole—At the beginning of ventriculardiastole, the pressure in the ventricles decreases below the pressure in the aorta and pulmonary trunk. The semilunar valves close and prevent blood from flowing back into the ventricles (figure 12.17, step 5).
· As diastole continues, the pressure continues to decline in the ventricles until atrial pressures are greater than ventricular pressures. Then the AV valves open, and blood flows directly from the atria into the relaxed ventricles. During the previous ventricular systole, the atria were relaxed and blood collected in them. When the ventricles relax and the AV valves open, blood flows into the ventricles (figure 12.17, step 1) and they begin to fill again.

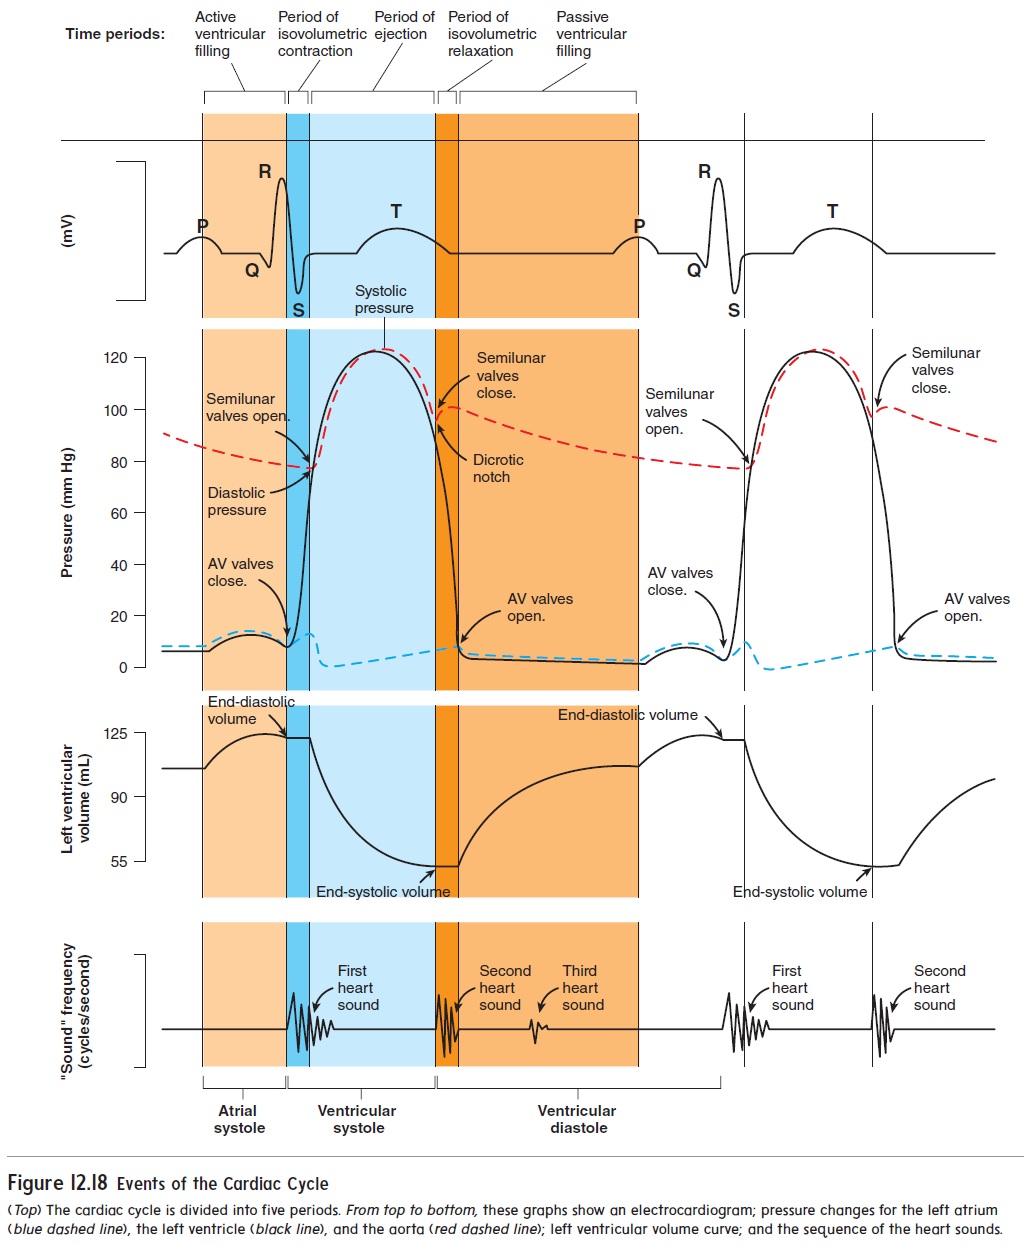
Figure 12.18 displays the main events of the cardiac cycle and should be examined from top to bottom for each period. The ECG indicates the electrical events that cause the atria and ventricles to contract and relax. The pressure graph shows the pressure changes within the left atrium (blue dashed line), left ventricle (black line), and aorta (red dashed line) resulting from atrial and ventricular contraction and relaxation. The pressure changes in the right side of the heart are not shown here, but they are similar to those in the left side, only lower. The volume graph presents the changes in left ventricular volume as blood flows into and out of the left ventricle as a result of the pressure changes. The sound graph records the closing of valves caused by blood flow. See figure 12.17 for illus-trations of the valves and blood flow.
Related Topics