Chapter: Medical Surgical Nursing: Management of Patients With Dysrhythmias and Conduction Problems
Dysrhythmias: Interpretation of the Electrocardiogram
INTERPRETATION OF THE ELECTROCARDIOGRAM
The
electrical impulse that travels through the heart can be viewed by means of
electrocardiography, the end product of which is an electrocardiogram (ECG).
Each phase of the cardiac cycle is reflected by specific waveforms on the
screen of a cardiac monitor or on a strip of ECG graph paper.
An
ECG is obtained by slightly abrading the skin with a clean dry gauze pad and
placing electrodes on the body at specific areas. Electrodes come in various
shapes and sizes, but all have two com-ponents: (1) an adhesive substance that
attaches to the skin to secure the electrode in place and (2) a substance that
reduces the skin’s elec-trical impedance and promotes detection of the
electrical current.
The
number and placement of the electrodes depend on the type of ECG needed. Most
continuous monitors use two to five electrodes, usually placed on the limbs and
the chest. These elec-trodes create an imaginary line, called a lead, that
serves as a ref-erence point from which the electrical activity is viewed. A
lead is like an eye of a camera; it has a narrow peripheral field of vision,
looking only at the electrical activity directly in front of it. There-fore,
the ECG waveforms that appear on the paper or cardiac monitor represent the
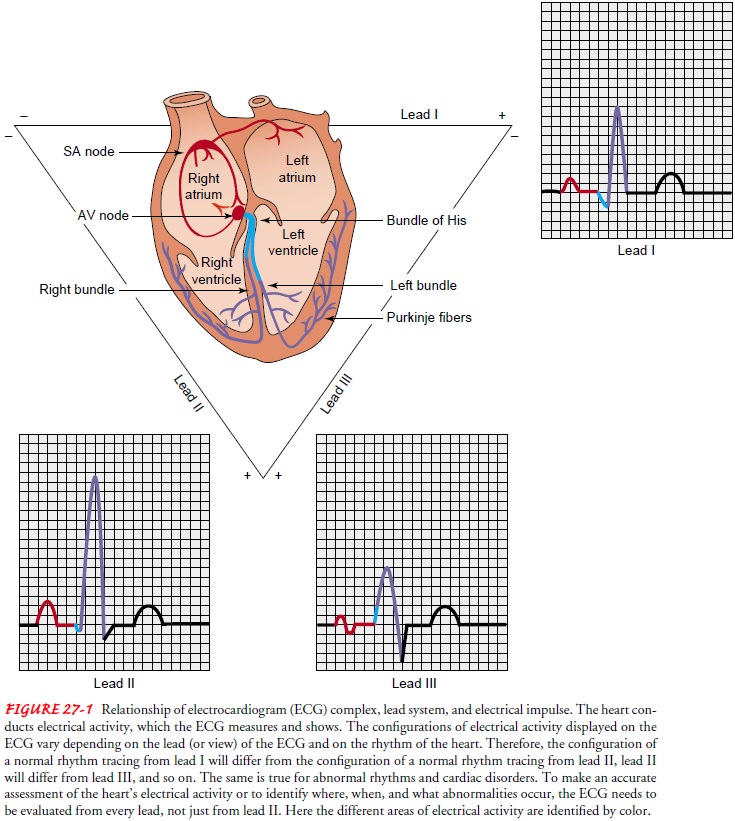
electrical current in relation to the lead (see Fig. 27-1). A change in the
waveform can be caused by a change in the electrical current (where it originates
or how it is con-ducted) or by a change in the lead.
Obtaining an Electrocardiogram
Electrodes
are attached to cable wires, which are connected to one of the following:
·
An ECG machine placed at the
patient’s side for an imme-diate recording (standard 12-lead ECG)
·
A cardiac monitor at the patient’s
bedside for continuous reading; this kind of monitoring, usually called
hardwire monitoring, is associated with intensive care units
·
A small box that the patient carries
and that continuously transmits the ECG information by radio waves to a central
monitor located elsewhere (called telemetry)
·
A small, lightweight tape
recorder-like machine (called a Holter monitor) that the patient wears and that
continu-ously records the ECG on a tape, which is later viewed and analyzed
with a scanner
The
placement of electrodes for continuous monitoring, te-lemetry, or Holter
monitoring varies with the type of technol-ogy that is appropriate and
available, the purpose of monitoring, and the standards of the institution. For
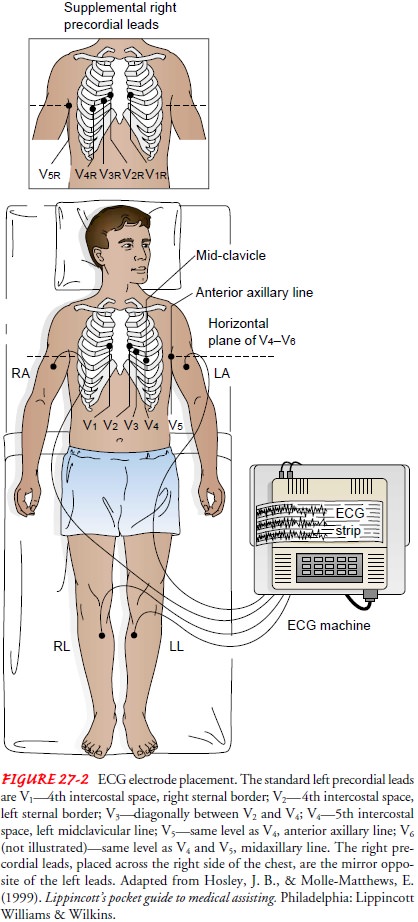
a standard 12-lead ECG, 10 electrodes (six on the chest and four on the limbs)
are placed on the body (Fig. 27-2). To prevent interference from the electrical
activity of skeletal muscle, the limb electrodes are usually placed on areas
that are not bony and that do not have significant movement. These limb
electrodes provide the first six leads: leads I, II, III, aVR, aVL, and aVF.
The six chest electrodes are attached to the chest at very specific areas. The
chest electrodes provide the V or precordial leads, V1
through V6. To locate the fourth intercostal
space and the placement of V1, locate
the sternal angle and then the sternal notch, which is about 1 or 2 inches
below the sternal angle. When the fin-gers are moved to the patient’s immediate
right, the second rib can be palpated. The second intercostal space is the
indentation felt just below the second rib.
Locating
the specific intercostal space is critical for correct chest electrode
placement. Errors in diagnosis can occur if electrodes are incorrectly placed.
Sometimes, when the patient is in the hospital and needs to be monitored
closely for ECG changes, the chest electrodes are left in place to ensure the
same placement for follow-up ECGs.
A standard 12-lead ECG reflects the electrical activity pri-marily in the left ventricle. Placement of additional electrodes for other leads may be needed to obtain more complete information. For example, in patients with suspected right-sided heart dam-age, right-sided precordial leads are required to evaluate the right ventricle (see Fig. 27-2).
Analysis of the Electrocardiogram
The
ECG waveform represents the function of the heart’s con-duction system, which
normally initiates and conducts the elec-trical activity, in relation to the
lead. When analyzed accurately, the ECG offers important information about the
electrical activity of the heart. ECG waveforms are printed on graph paper that
is divided by light and dark vertical and horizontal lines at standard intervals
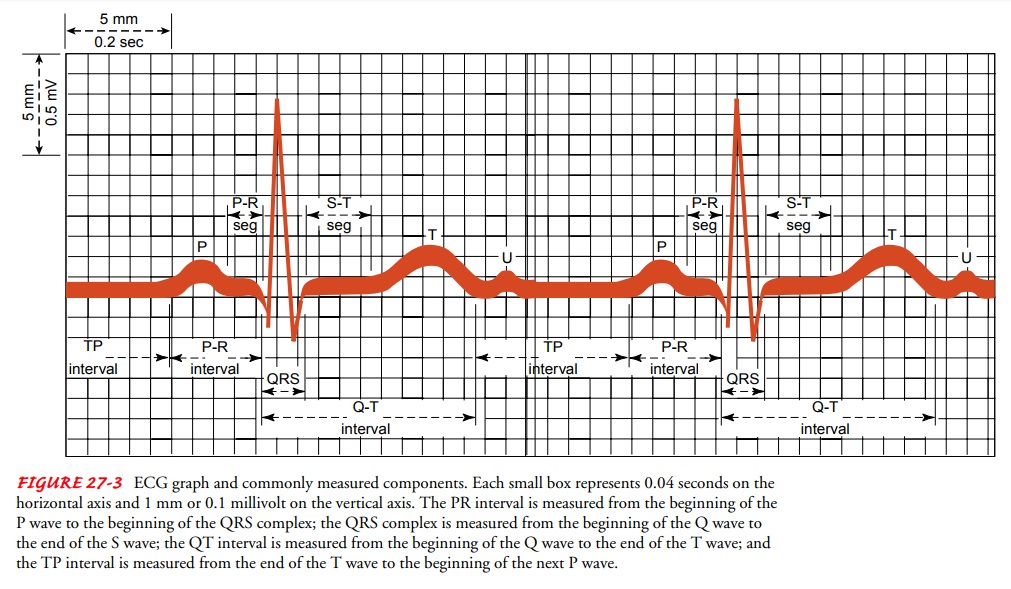
(Fig. 27-3). Time and rate are measured on the hori-zontal axis of the graph,
and amplitude or voltage is measured on the vertical axis. When an ECG waveform
moves toward the top of the paper, it is called a positive deflection. When it
moves to-ward the bottom of the paper, it is called a negative deflection. When
reviewing an ECG, each waveform should be examined and compared with the
others.
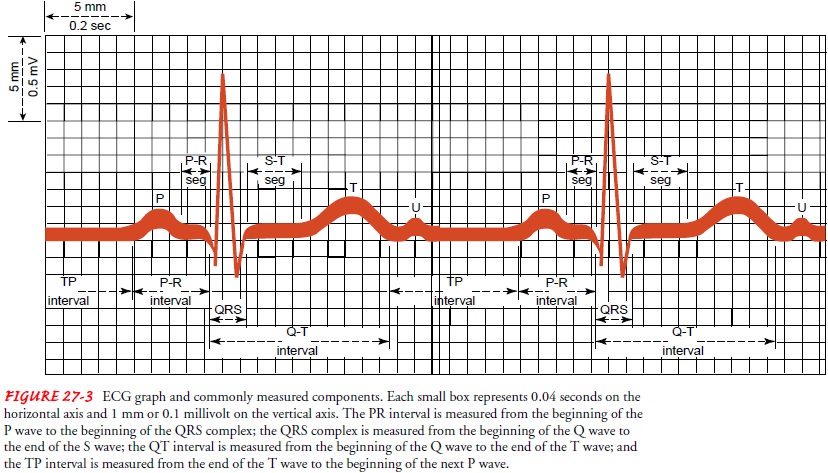
WAVES, COMPLEXES, AND INTERVALS
The
ECG is composed of waveforms (including the P wave, the QRS complex, the T
wave, and possibly a U wave) and of seg-ments or intervals (including the PR
interval, the ST segment, and the QT interval) (see Fig. 27-3).
The
P wave represents the electrical
impulse starting in the sinus node and spreading through the atria. Therefore,
the P wave represents atrial muscle depolarization. It is normally 2.5 mm or
less in height and 0.11 second or less in duration.
The
QRS complex represents ventricular
muscle depolariza-tion. Not all QRS complexes have all three waveforms. The
first negative deflection after the P wave is the Q wave, which is nor-mally
less than 0.04 second in duration and less than 25% of the R wave amplitude;
the first positive deflection after the P wave is the R wave; and the S wave is
the first negative deflection after the R wave. When a wave is less than 5 mm
in height, small letters (q, r, s) are used; when a wave is taller than 5 mm,
capital letters (Q, R, S) are used. The QRS complex is normally less than 0.12
sec-onds in duration.
The
T wave represents ventricular muscle
repolarization (when the cells regain a negative charge; also called the
resting state). It follows the QRS complex and is usually the same direction as
the QRS complex.
The
U wave is thought to represent
repolarization of the Purkinje fibers, but it sometimes is seen in patients
with hypo-kalemia (low potassium levels), hypertension, or heart disease. If
present, the U wave follows the T wave and is usually smaller than the P wave.
If tall, it may be mistaken for an extra P wave.
The
PR interval is measured from the
beginning of the P wave to the beginning of the QRS complex and represents the
time needed for sinus node stimulation, atrial depolarization, and con-duction
through the AV node before ventricular depolarization. In adults, the PR
interval normally ranges from 0.12 to 0.20 sec-onds in duration.
The
ST segment, which represents early
ventricular repolar-ization, lasts from the end of the QRS complex to the
beginning of the T wave. The beginning of the ST segment is usually iden-tified
by a change in the thickness or angle of the terminal por-tion of the QRS
complex. The end of the ST segment may be more difficult to identify because it
merges into the T wave. The ST segment is normally isoelectric (see discussion
of TP interval). It is analyzed to identify whether it is above or below the
iso-electric line, which may be, among other signs and symptoms, a sign of
cardiac ischemia.
The
QT interval, which represents the
total time for ventric-ular depolarization and repolarization, is measured from
the be-ginning of the QRS complex to the end of the T wave. The QT interval
varies with heart rate, gender, and age, and the measured interval needs to be
corrected for these variables through a spe-cific calculation. Several ECG
interpretation books contain charts of these calculations. The QT interval is
usually 0.32 to 0.40 sec-onds in duration if the heart rate is 65 to 95 beats
per minute. If the QT interval becomes prolonged, the patient may be at risk
for a lethal ventricular dysrhythmia called torsades de pointes.
The TP interval is measured from the end of the T wave to the beginning of the next P wave, an isoelectric period (see Fig 27-3).
When
no electrical activity is detected, the line on the graph re-mains flat; this
is called the isoelectric line. The ST segment is compared with the TP interval
to detect changes from the line on the graph during the isoelectric period.
The
PP interval is measured from the
beginning of one P wave to the beginning of the next. The PP interval is used
to determine atrial rhythm and atrial rate. The RR interval is measured from
one QRS complex to the next QRS complex. The RR interval is used to determine
ventricular rate and rhythm (Fig. 27-4).
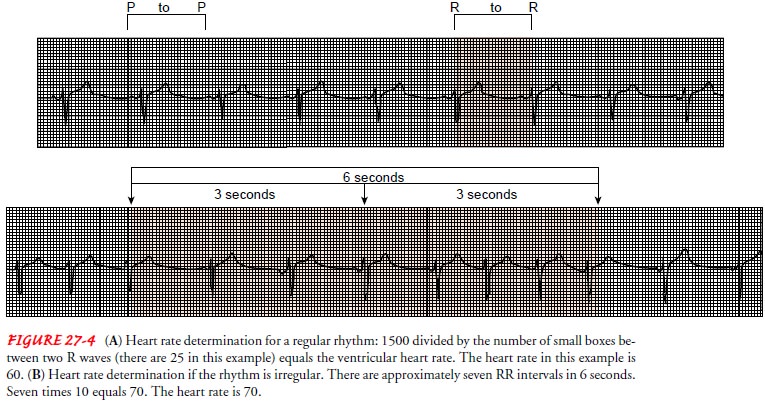
DETERMINING VENTRICULAR HEART RATE FROM THE ELECTROCARDIOGRAM
Heart
rate can be obtained from the ECG strip by several meth-ods. A 1-minute strip
contains 300 large boxes and 1500 small boxes. Therefore, an easy and accurate
method of determining heart rate with a regular rhythm is to count the number
of small boxes within an RR interval and divide 1500 by that number. If, for
example, there are 10 small boxes between two R waves, the heart rate is 1500 ÷ 10, or
150; if there are 25 small boxes, the heart rate is 1500 ÷ 25, or 60
(see Fig. 27-4A).
An
alternative but less accurate method for estimating heart rate, which is
usually used when the rhythm is irregular, is to count the number of RR
intervals in 6 seconds and multiply that number by 10. The top of the ECG paper
is usually marked at 3-second intervals, which is 15 large boxes horizontally
(see Fig. 27-4B). The RR intervals are counted, rather than QRS complexes,
because a computed heart rate based on the latter might be inaccurately high.
The
same methods may be used for determining atrial rate, using the PP interval
instead of the RR interval.
DETERMINING HEART RHYTHM FROM THE ELECTROCARDIOGRAM
The
rhythm is often identified at the same time the rate is deter-mined. The RR
interval is used to determine ventricular rhythm and the PP interval to
determine atrial rhythm. If the intervals are the same or nearly the same
throughout the strip, the rhythm is called regular. If the intervals are
different, the rhythm is called irregular.
Related Topics