Chapter: Graphics and Multimedia : Output Primitives
Computer graphics - Output Primitives
BASICS
Computer graphics is a
sub-field of computer science and is concerned with digitally synthesizing and
manipulating visual content. Although the term often refers to
three-dimensional computer graphics, it also encompasses two-dimensional
graphics and image processing.
Today, we find computer
graphics used routinely in such diverse areas as science, engineering,
medicine, business, industry,
government, art, entertainment, advertising, education, and training.
COMPUTER AIDED DESIGN
A major use of computer graphics is in design processes, particularly for
engineering and architectural systems, but almost all products are now computer
designed. Generally referred to as CAD, computer-aided design methods are now
routinely used in the design of buildings, automobiles, aircraft, watercraft,
spacecraft, computers, textiles, and many, many other products.
PRESENTATION GRAPHICS
Another major application area is presentation graphics, used to
produce illustrations for reports or
to generate 35-mm slides or
transparencies for use with projectors. Presentation graphics is commonly used to summarize financial,
statistical, mathematical, scientific, and economic data for research reports, managerial reports, consumer
information bulletins, and other types of reports. Workstation devices and service bureaus exist for converting
screen displays into 35-mm slides or
overhead transparencies for use in presentations.
Typical examples of
presentation graphics are bar charts, line graphs, surface graphs, pie charts, and other displays showing
relationships between multiple parameters.
COMPUTER ART
Computer graphics methods are
widely used in both fine art and commercial art applications. Artists use a
variety of computer methods, including special-purpose hardware, artist's
paintbrush (such as Lumens), other paint packages (such as Pixelpaint and
Superpaint),.
VISUALIZATION
Scientists, engineers,
medical personnel, business analysts, and others often need to analyze large
amounts of information or to study the behavior of certain processes. Numerical
simulations carried out on supercomputers frequently produce data files
containing thousands and even millions of data values..
GRAPHICAL USER INTERFACES
It is common now for software
packages to provide a graphical interface. A major component of a graphical
interface is a window manager that allows a user to display multiple-window
areas. Each window can contain a different process that can contain graphical
or nongraphical displays. To make a particular window active, we simply click
in that window using an interactive pointing device.Interfaces also display
menus and icons for fast selection of processing options or parameter values.
GRAPHIC SYSTEMS
VIDEO DISPLAY DEVICES
Typically, the primary output
device in a graphics system is a video monitor The operation of most video
monitors is based on the standard cathode-ray tube (CRT) design.
The basic operation of a CRT A
beam of electrons (cathode rays), emitted by an electron gun, passes through
focusing and deflection systems that direct the beam toward specified positions
on the phosphomted screen. The phosphor then emits a small spot of light at
each position contacted by the electron beam. Because the light emitted by the
phosphor fades very rapidly, some method is needed for maintaining the screen
picture. One way to keep the phosphor glowing is to redraw the picture
repeatedly by quickly directing the electron beam back over the same points.
This type of display is called a refresh
CRT.
Raster-Scan Displays
The most common type of
graphics monitor employing a CRT is the raster-scan display, based on
television technology.
In a raster-scan system, the
electron beam is swept across the screen, one row at a time from top to bottom.
As the electron beam moves across each row, the beam intensity is turned on and
off to create a pattern of illuminated spots. Picture definition is stored in a
memory area called the refresh buffer or frame buffer. This memory area holds
the set of intensity values for all the screen points. Stored intensity values
are then retrieved from the refresh buffer and "painted" on the
screen one row (scan line) at a time .Each screen point is referred to as a
pixel or pel (shortened fonns of picture element). The capability of a
raster-scan system to store intensity information for each screen point makes
it well suited for the realistic displav of scenes containing subtle shading
and color patterns.
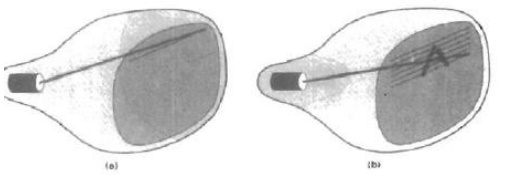
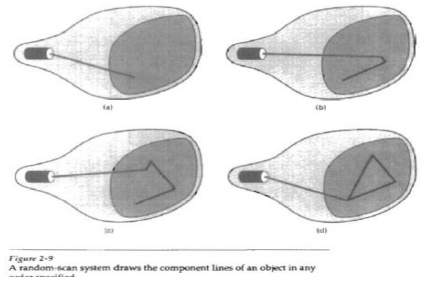
Random-Scan Displays
When operated as a
random-scan display unit, a CRT has the electron beam directed only to the
parts of the screen where a picture is to be drawn. Randomscan monitors draw a
picture one line at a time and for this reason are also referred to as vector
displays (or stroke-writing or calligraphic diisplays). The component lines of
a picture can be drawn and refreshed by a random-scan system in any specified
order
Refresh rate on a random-scan
system depends on the number of lines to be displayed. Picture definition is
now stored as a set of line drawing commands in an area of memory referred to
as the refresh display file. Sometimes the refresh display file is called the
display list, display program, or simply the refresh buffer.
To display a specified
picture, the system cycles through the set of commands in the display file,
drawing each component line in turn. After all line drawing commands have been
processed, the system cycles back to the first line command in the list.
Random-scan displays are designed to draw all the component lines of a picture
30 to 60 times each second. High quality vector systems arecapable of handling
approximately 100,000 "short" lines at this refresh rate. When a
small set of lines is to be displayed, each rrfresh cycle is delayed to avoid
refresh rates greater than 60 frames per second. Otherwise, faster refreshing
of the set of lines could bum out the phosphor.
OUTPUT PRIMITIVES
1.
A picture can be described in several ways. In raster display, a
picture is completely specified by the set of intensities for the pixel
positions in the display. At the other extreme, we can describe a picture as a
set of complex objects, such as trees and terrain or furniture and walls,
positioned at specified coordinate locations within the scene.
2.
Shapes and colors of the objects can be described internally with
pixel arrays or with sets of basic geometric structures, such as straight line
segments and polygon color areas. The scene is then displayed either by loading
the pixel arrays into the frame buffer or by scan converting the basic
geometric-structure specifications into pixel patterns.
POINTS AND LINES
1 Point
plotting is accomplished by converting a single coordinate position furnished
by an application program into appropriate operations for the output device in
use.
The
formula for the point to be plotted is putpixel(x,y,color)
Related Topics