Mapping Skills | Geography - Components of a map | 9th Social Science : Geography: Mapping Skills
Chapter: 9th Social Science : Geography: Mapping Skills
Components of a map
Components
of a map
A map should
include the following components namely, the title,
scale, direction, grid system, projection,
legend, conventional signs and symbols.
(A) Title
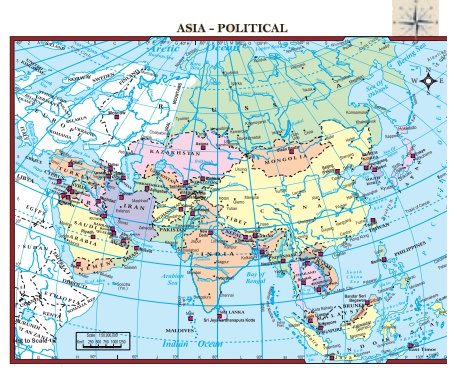
It indicates the purpose or theme of the map. Example: India – Physical, World – Political, Tamil Nadu – Transport.
(B) Scale
Scale makes it
possible to reduce the size of the whole earth to show it on a piece of
paper. A scale is a ratio
between the actual distance
on the map to the actual distance on
the ground. Scales can be represented
in three methods. They are the Statement,
Representative Fraction (R.F)
and Linear or Graphical scale methods.
Statement scale
The statement scale describes the
relationship of map distance to ground distance in words, such
as one centimetre to ten kilometres. It is expressed as 1cm = 10 km.
The Representative Fraction (R.F)
It describes the proportion or ratio of the map distance to ground distance. It is usually abbreviated as R.F. It is stated as 1/100000 (or) 1:100000. This means that one unit on the map represents 100,000 of the same unit on the ground. This unit may be an inch or a centimetre or any other linear measurement unit. Thus,
Representative Fraction (R.F.) = Distance on
the map / Distance on the ground
For example: To find the RF when the scale is
1 cm to 1km. Here, 1 cm =1 km
According to the formula, R.F= 1 cm / 1 km
Convert the km to cm. Therefore, 1km =100000
cm. So, RF. is 1:100000.
Find the R.F. when the scale is 1 centimetre to 2 kilometre.
Linear (or) Graphical
scale
In a map, a linear scale is represented by a straight line
divided into equal parts (Primary and secondary) to show what these markings
represent on the actual ground. This scale helps in the direct measurement of
distance on the map.
Linear scale model

(C) Direction
Maps are drawn
normally with north orientation. North direction in a map is always towards
the North Pole of the earth.
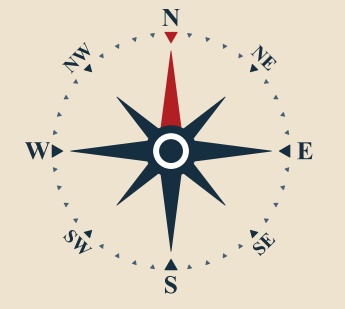
If you position yourself looking
at the North Pole, on your
right will be the east; your left will be the
west; at your back will be south. These four main directions are called the cardinal
directions. Direction is usually
indicated on a map by a
North-South line, with the North direction represented by an arrow head.
(D) Grid System
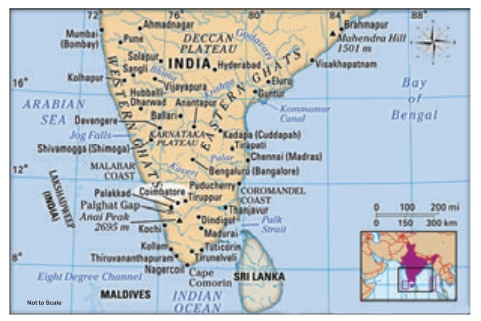
The location of a place can be simply defined by its latitude
and longitude. In normal
practice, latitude is stated first
and then comes the longitude. The latitude
and longitude of a place can be expressed
in units of degree, minutes and seconds.
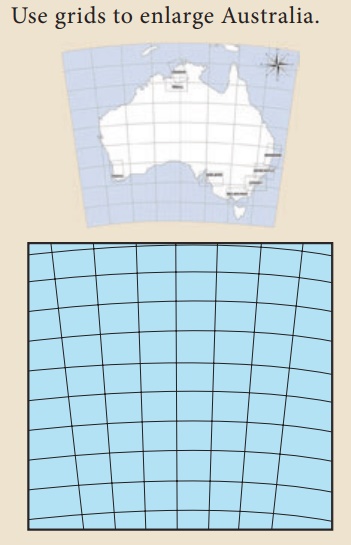
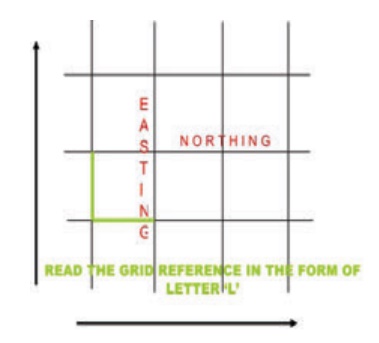
A grid is a set of lines with alphanumeric codes for defining a
location on a map in many topographical sheets. The lines that run horizontally from
left to right
of the map
are known as northings, whereas, the lines that
run vertically from
the top to the bottom
of the map are called
eastings. The
points at which the vertical and horizontal lines of the grid intersect are called coordinates which are identified by numbers or letters.
(E) Projection
A map projection is a
way of showing the spherical
shaped earth on a flat piece of paper. Where does the word 'projection' come from?
Imagine a clear globe with latitude and
longitude lines and the outlines of the
landmasses on it.
Suppose there was a light bulb
inside the globe. If you wrapped a piece of
paper around the globe and turned on the light bulb,
the outlines of the grid and landmasses
would be projected onto the paper.
Map projection is defined as the transformation of spherical network of latitudes
and longitudes on a plane surface. Projections are drawn to
maintain the shape,
area and directions.
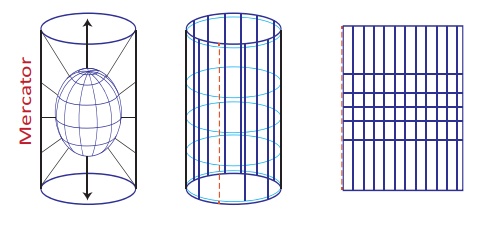
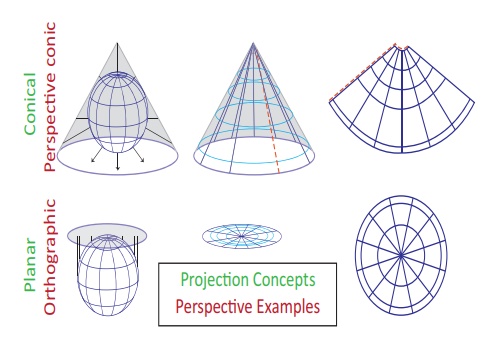
The three methods in widest use are as follows:
·
Projection
on the surface of a cylinder
·
Projection
on to the surface of a cone
·
Projection
directly onto a flat plane, called planar or zenithal or azimuthal projection
(F) Legend
The legend of a map helps to understand the map details
which are placed at the left or right corner at the bottom of the map.
(G) Conventional signs and symbols
A map is a global language and
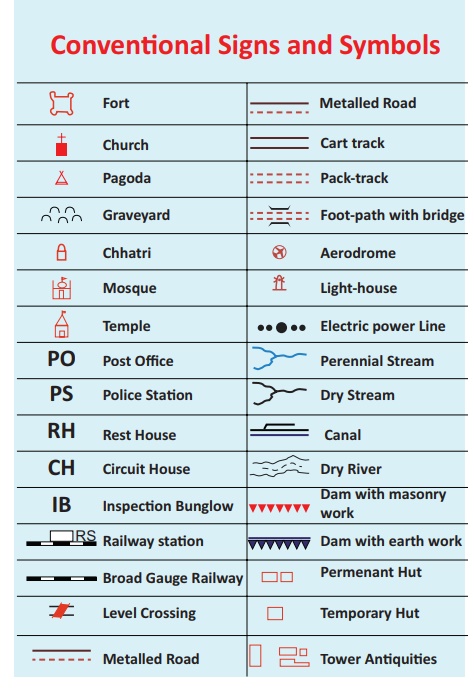
it needs to be drawn according to the international standards. Conventional signs and symbols are standard symbols
used on a map and explained
in the legend to convey a definite meaning. The topographic map contains
a variety of information about physical and cultural features. These
are shown by using signs
and symbols in various colours
so that the clarity
of the map is maintained.
There are three types of map symbols
1.
Point Symbols
- buildings,
dipping tanks, trigonometrical beacons
2.
Line Symbols - railways, roads, power
lines, telephone lines
3.
Area Symbols - Cultivated lands, ponds, orchards
and vineyards
The following colour
codes are used with map symbols
1.
Brown: land or earth features
- contour lines, eroded areas, prominent rock outcrops, sand areas and dunes, secondary or gravel roads
2.
Light Blue: water features - canals, coastlines,
dams, lakes, marshes, swamps and
levees, ponds, rivers and water towers.
3. Dark Blue: national waterways
4. Green: vegetation features - cultivated fields, golf courses, nature and
game reserve
boundaries, orchards and vineyards, recreation grounds, woodland
5. Black: construction features - roads, tracks, railways, buildings, bridges,
cemeteries, communication towers, dam walls, excavations
and mine dumps, telelphone lines, power lines, windpumps,
boundaries
6. Red: construction features - national, arterial and main roads, lighthouses and marine lights
7.
Pink: international boundaries
Related Topics