Chapter: Pharmaceutical Biotechnology: Fundamentals and Applications : Biophysical and Biochemical Analysis of Recombinant Proteins
Chromatography - Proteins Analytical Techniques
Chromatography
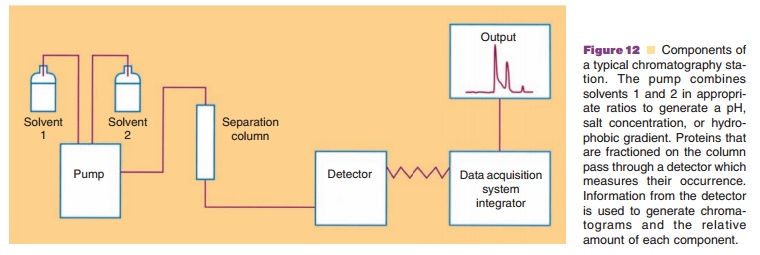
Chromatography techniques are used extensively in biotechnology not only in protein purification procedures, but also in assessing the integrity of the product. Routine procedures are highly automated so that comparisons of similar samples can be made. An analytical system consists of an autosampler which will take a known amount (usually a known volume) of material for analysis and automatically places it in the solution stream headed toward a separation column used to fractionate the sample. Another part of this system is a pump module which provides a reproducible flow rate. In addition, the pumping system can provide a gradient which changes properties of the solution such as pH, ionic strength, and hydrophobicity. A detection system (or possibly multiple detectors in series) is located at the outlet of the column. This measures the relative amount of protein exiting the column. Coupled to the detector is a data acquisition system which takes the signal from the detector and integrates it into avalue related to the amount of material (Fig. 12). When the protein appears, the signal begins to increase, and as the protein passes through the detector, the signal subsequently decreases. The area under the peak of the signal is proportional to the amount of material which has passed through the detector. By analyzing known amounts of protein, an area versus amount of protein plot can be generated and this may be used to estimate the amount of this protein in the sample under other circumstances. Another benefit of this integrated chromatography system is that low levels of compo-nents which appear over time can be estimated relative to the major desired protein being analyzed. This is a particularly useful function when the long-term stability of the product is under evaluation.

Chromatographic systems offer a multitude of different strategies for successfully separating protein mixtures and for quantifying individual protein components. The following describes some of these strategies.
Size Exclusion Chromatography
As the name implies, this procedure separates proteins based on their size or molecular weight or shape. The matrix consists of very fine beads contain-ing cavities and pores accessible to molecules of a certain size or smaller, but inaccessible to larger molecules. The principle of this technique is the distribution of molecules between the volume of solution within the beads versus the volume of solution surrounding the beads. Small molecules have access to a larger volume than do large molecules. As solution flows through the column, molecules can diffuse back and forth, depending upon their size, in and out of the pores of the beads. Smaller molecules can reside within the pores for a finite period of time whereas larger molecules, unable to enter these spaces, continue along in the fluid stream. Intermediate-sized molecules spend an intermediate amount of time within the pores. They can be fractionated from large molecules that cannot access the matrix space at all and from small molecules that have free access to this volume and spend most of the time within the beads. Protein molecules can dis-tribute between the volume within these beads and the excluded volume based on the mass and shape of the molecule. This distribution is based on the relative concentration of the protein in the beads versus the excluded volume.
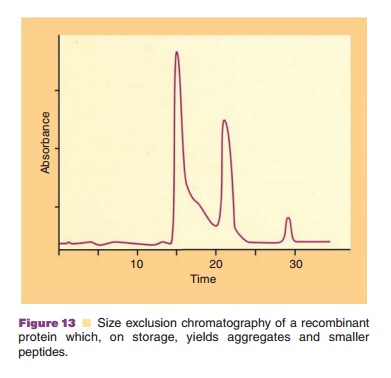
Size exclusion chromatography can be used to estimate the mass of proteins by calibrating the column with a series of globular proteins of known mass. However, the separation depends on mole-cular shape (conformation) as well as mass, and highly elongated proteins—proteins containing flexible, disordered regions—and glycoproteins will often appear to have masses as much as two to three times the true value. Other proteins may interact weakly with the column matrix and be retarded, thereby appearing to have a smaller mass. Thus, sedimentation or light scattering methods are preferred for accurate mass measure-ment. Over time, proteins can undergo a number of changes that affect their mass. A peptide bond within the protein can hydrolyze, yielding two smaller polypeptide chains. More commonly, size exclusion chromatography is used to assess aggre-gated forms of the protein. Figure 13 shows an example of this. The peak at 22 minutes represents the native protein. The peak at 15 minutes is aggregated protein and that at 28 minutes depicts degraded protein yielding smaller polypeptide chains. Aggregation can occur when a protein molecule unfolds to a slight extent and exposes surfaces that are attracted to complementary surfaces on adjacent molecules. This interaction can lead to dimerization or doubling of molecular weight or to higher molecular weight oligomers. From the chromatographic profile, the mechanism of aggregation can often be implicated. If dimers, trimers, tetramers, etc. are observed, then aggrega-tion occurs by stepwise interaction of a monomer with a dimer, trimer, etc. If dimers, tetramers, octamers, etc. are observed, then aggregates can interact with each other. Sometimes, only mono-mers and high molecular weight aggregates are observed, suggesting that intermediate species are kinetically of short duration and protein molecules susceptible to aggregation combine into very large molecular weight complexes.

Reversed-Phase High Performance
Liquid Chromatography
Reversed-phase high performance liquid chromato-graphy (RP-HPLC) takes advantage of the hydro-phobic properties of proteins. The functional groups on the column matrix contain from one to up to eighteen carbon atoms in a hydrocarbon chain. The longer this chain, the more hydro-phobic is the matrix. The hydrophobic patches of proteins interact with the hydrophobic chromatographic matrix. Proteins are then eluted from the matrix by increasing the hydrophobic nature of the solvent passing through the column. Acetonitrile is a common solvent used, although other organic solvents such as ethanol also may be employed. The solvent is made acidic by the addition of trifluoroacetic acid, since proteins have increased solubility at pH values further removed from their pI. A gradient with increasing concentra-tion of hydrophobic solvent is passed through the column. Different proteins have different hydropho-bicities and are eluted from the column depending on the “hydrophobic potential” of the solvent.
This technique can be very powerful. It may detect the addition of a single oxygen atom to the protein, as when a methionyl residue is oxidized, or when the hydrolysis of an amide moiety on a glutamyl or asparginyl residue occurs. Disulfide bond formation or shuffling also changes the hydrophobic characteristic of the protein. Hence, RP-HPLC can be used not only to assess the homogeneity of the protein, but also to follow degradation pathways occurring during long term storage.
Reversed-phase chromatography of proteolytic digests of recombinant proteins may serve to identify this protein. Enzymatic digestion yields unique peptides that elute at different retention times or at different organic solvent concentrations. Moreover, the map, or chromatogram, of peptides arising fromenzymatic digestion of one protein is quite different from the map obtained from another protein. Several different proteases, such as trypsin, chymotrypsin and other endoproteinases, are used for these identity tests (see below under Mass Spectrometry).
Hydrophobic Interaction Chromatography
A companion to RP-HPLC is hydrophobic interaction chromatography (HIC), although in principle this latter method is normal-phase chromatography, i.e., here an aqueous solvent system rather than an organic one is used to fractionate proteins. The hydrophobic characteristics of the solution are modulated by inorganic salt concentrations. Ammonium sulfate and sodium chloride are often used since these compounds are highly soluble in water. In the presence of high salt concentrations (up to several molar), proteins are attracted to hydrophobic surfaces on the matrix of resins used in this technique. As the salt concentration decreases, proteins have less affi-nity for the matrix and eventually elute from the column. This method lacks the resolving power of RP-HPLC, but is a more gentle method, since low pH values or organic solvents as used in RP-HPLC can be detrimental to some proteins.
Ion Exchange Chromatography
This technique takes advantage of the electronic charge properties of proteins. Some of the amino acyl residues are negatively charged and others are positively charged. The net charge of the protein can be modulated by the pH of its environment relative to the pI value of the protein. At a pH value lower than the pI, the protein has a net positive charge, whereas at a pH value greater than the pI, the protein has a net negative charge. Opposites attract in ion-exchange chromatography. The resins in this procedure can contain functional groups with posi-tive or negative charges. Thus, positively charged proteins bind to negatively charged matrices and negatively charged proteins bind to positively charged matrices. Proteins are displaced from the resin by increasing salt, e.g., sodium chloride, concentrations. Proteins with different net charges can be separated from one another during elution with an increasing salt gradient. The choice of charged resin and elution conditions are dependent upon the protein of interest.
In lieu of changing the ionic strength of the solution, proteins can be eluted by changing the pH of the medium, i.e., with the use of a pH gradient. This method is called chromatofocusing and proteins are separated based on their pI values. When the solvent pH reaches the pI value of a specific protein, the protein has a zero net charge and is no longer attracted to the charged matrix and hence is eluted.
Other Chromatographic Techniques
Other functional groups may be attached to chro-matographic matrices to take advantage of unique properties of certain proteins. These affinity meth-odologies, however, are more often used in the manufacturing process than in analytical techniques. For example, conventional affinity purification schemes of antibodies use Protein-A or -G columns. Protein-A or -G specifically binds antibodies. Antibodies consist of variable regions and constant regions. The variable regions are antigen-specific and hence vary in sequence from one antibody to another, while the constant regions are common to each subgroup of antibodies. The constant region binds to Protein-A or -G.
Related Topics