Economics - An Indifference Map | 11th Economics : Chapter 2 : Consumption Analysis
Chapter: 11th Economics : Chapter 2 : Consumption Analysis
An Indifference Map
An
Indifference Map
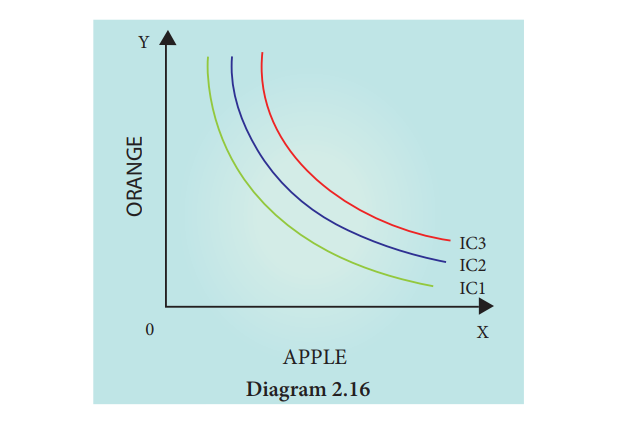
One can draw several indifference curves each representing an indifference schedule. Hence, an Indifference Map is a family or collection or set of indifference curves corresponding to different levels of satisfaction. The Indifference Map is illustrated in Diagram 2.16.
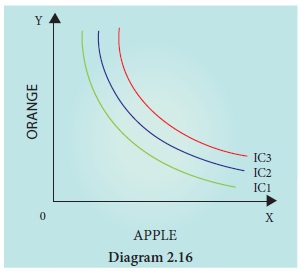
In the
diagram 2.16, the indifference Curves IC1, IC2 and IC3
represent the Indifference Map, Upper IC representing higher level of
satisfaction compared to lower IC.
Marginal Rate of Substitution
The shape
of an indifference curve provides useful information about preferences.
Indifference curve replaces the concept of marginal utility with the concept of
the marginal rate of substitution.
According
to Leftwich “The marginal rate of
substitution of x for y (MRSxy) is defined as the maximum amount of y the consumer is willing to give up for
getting an additional unit of x and still remaining on the same indifference
curve”.
Related Topics