Economics - An Indifference Curve | 11th Economics : Chapter 2 : Consumption Analysis
Chapter: 11th Economics : Chapter 2 : Consumption Analysis
An Indifference Curve
An Indifference Curve
Different
combinations of two commodities (as found in Indifference Schedule) can be
presented in a diagram. Then consumer gets different points and when such
points are connected, a curve is obtained. The said curve is called as
“Indifference Curve”. Therefore, an indifference curve is the locus of all
combinations of commodities from which the consumer derives the same level of
satisfaction. It is also called “Iso-Utility Curve” or” Equal Satisfaction
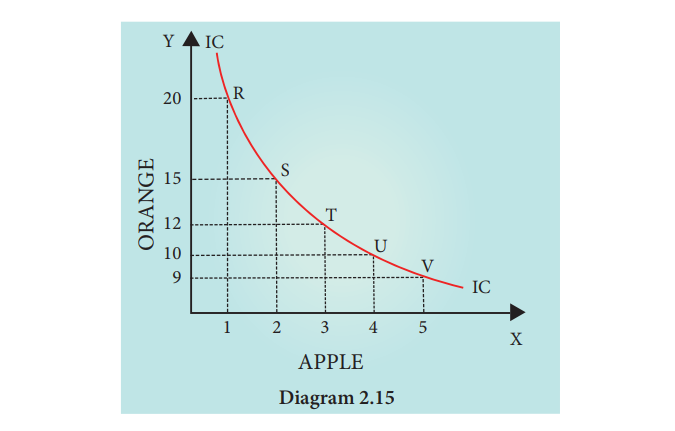
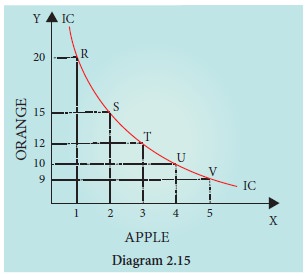
Curve”. Indifference Curve is illustrated in diagram 2.15. X axis represents
apple and Y axis represents orange. Point ‘R’ represents combination of 1 apple
and 20 oranges, at ‘S’ 2 apples and 15 oranges and at ’T’ 3 apples and 12
oranges. Similarly UKV points are obtained. These five points give the same
level of satisfaction. The consumer will be neither better off nor worse off in
choosing any one of these points. When one joins all these five points (RS, T)
U and V one can get the Indifference Curve ‘IC’.
Related Topics