Chapter: physics 11th 12th standard school college definition answer assignment examination viva question
Neutral and Inversion temperature
Neutral and Inversion temperature
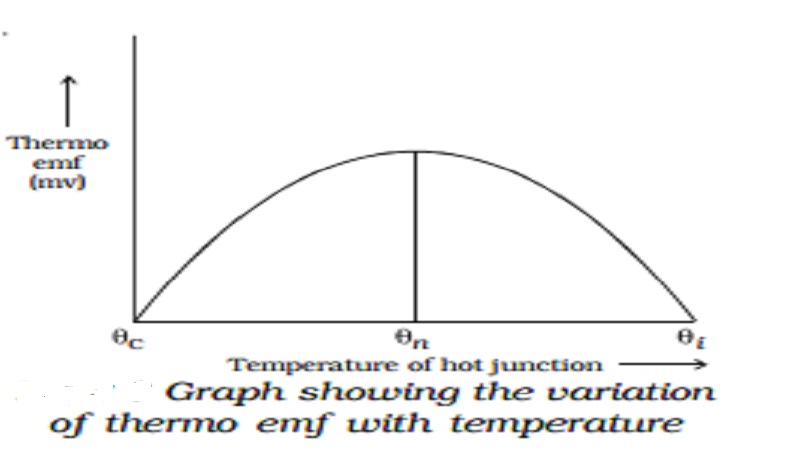
The graph showing the variation of thermoemf with temperature of the hot junction, taking the temperature of the cold junction (θC) as origin is shown in Fig 3.3. For small difference in temperature between the junctions, the graph is a straight line. For large difference in temperature, the graph is a parabola.
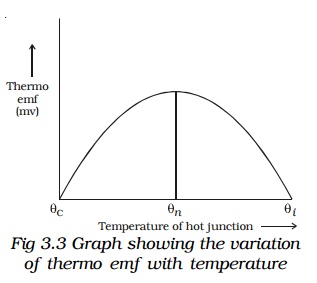
Keeping the temperature of the cold junction constant, the temperature of the hot junction is gradually increased. The thermo emf rises to a maximum at a temperature (θn) called neutral temperature and then gradually decreases and eventually becomes zero at a particular temperature (θi) called temperature of inversion. Beyond the temperature of inversion, the thermoemf changes sign and then increases.
For a given thermocouple, the neutral temperature is a constant, but the temperature of inversion depends upon the temperature of cold junction. These temperatures are related by the expression
Related Topics