Chapter: Medical Physiology: Cardiac Output, Venous Return, and Their Regulation
Methods for Measuring Cardiac Output
Methods for Measuring Cardiac Output
In animal experiments, one can cannulate the aorta, pul-monary artery, or great veins entering the heart and measure the cardiac output using any type of flowmeter. An electromagnetic or ultrasonic flowmeter can also be placed on the aorta or pulmonary artery to measure cardiac output.
In the human, except in rare instances, cardiac output is measured by indirect methods that do not require surgery. Two of the methods commonly used are the oxygen Fick method and the indicator dilution method.
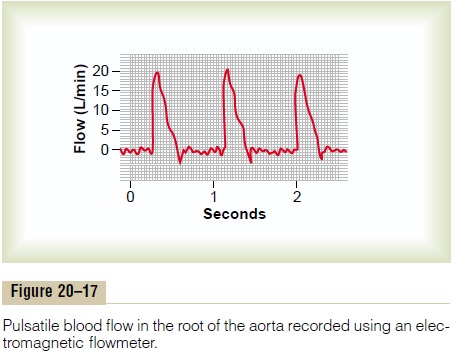
Pulsatile Output of the Heart as Measured by an Electromagnetic or Ultrasonic Flowmeter
Figure 20–17 shows a recording in a dog of blood flow in the root of the aorta made using an electromagnetic flowmeter. It demonstrates that the blood flow rises rapidly to a peak during systole, and then at the end of systole reverses for a fraction of a second. This reverse flow causes the aortic valve to close and the flow to return to zero.
Measurement of Cardiac Output Using the Oxygen Fick Principle
The Fick principle is explained by Figure 20–18. This figure shows that 200 milliliters of oxygen are being absorbed from the lungs into the pulmonary blood each minute. It also shows that the blood entering the right heart has an oxygen concentration of 160 milli-liters per liter of blood, whereas that leaving the left heart has an oxygen concentration of 200 milliliters per liter of blood. From these data, one can calculate that each liter of blood passing through the lungs absorbs 40 milliliters of oxygen.
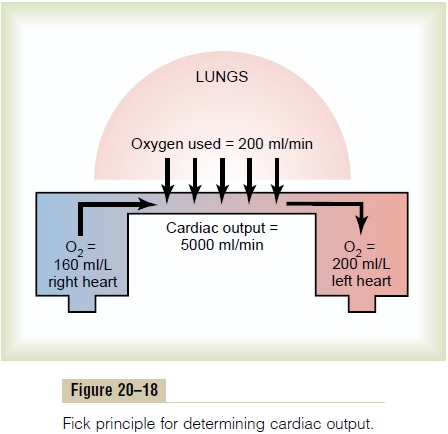
Because the total quantity of oxygen absorbed into the blood from the lungs each minute is 200 milliliters, dividing 200 by 40 calculates a total of five 1-liter por-tions of blood that must pass through the pulmonary circulation each minute to absorb this amount of oxygen. Therefore, the quantity of blood flowing through the lungs each minute is 5 liters, which is also a measure of the cardiac output. Thus, the cardiac output can be calculated by the following formula:
Cardiac output (L/min)
In applying this Fick procedure for measuring cardiac output in the human being, mixed venousblood is usually obtained through a catheter insertedup the brachial vein of the forearm, through the sub-clavian vein, down to the right atrium, and, finally, into the right ventricle or pulmonary artery. And systemicarterial blood can then be obtained from any systemicartery in the body. The rate of oxygen absorption by the lungs is measured by the rate of disappearance of oxygen from the respired air, using any type of oxygen meter.
Indicator Dilution Method for Measuring Cardiac Output
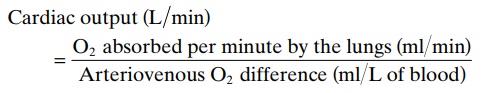
To measure cardiac output by the so-called “indicator dilution method,” a small amount of indicator, such as a dye, is injected into a large systemic vein or, prefer-ably, into the right atrium. This passes rapidly through the right side of the heart, then through the blood vessels of the lungs, through the left side of the heart and, finally, into the systemic arterial system. The con-centration of the dye is recorded as the dye passes through one of the peripheral arteries, giving a curve as shown in Figure 20–19. In each of these instances, 5 mil-ligrams of Cardio-Green dye was injected at zero time. In the top recording, none of the dye passed into the arterial tree until about 3 seconds after the injection, but then the arterial concentration of the dye rose rapidly to a maximum in about 6 to 7 seconds. After that, the concentration fell rapidly, but before the concentration reached zero, some of the dye had already circulated all the way through some of the peripheral systemic vessels and returned through the heart for a second time. Con-sequently, the dye concentration in the artery began to rise again. For the purpose of calculation, it is necessary to extrapolate the early down-slope of the curve to the zero point, as shown by the dashed portion of each curve. In this way, the extrapolated time-concentrationcurve of the dye in the systemic artery without recircu-lation can be measured in its first portion and estimated reasonably accurately in its latter portion.
Once the extrapolated time-concentration curve has been determined, one then calculates the mean con-centration of dye in the arterial blood for the duration of the curve.
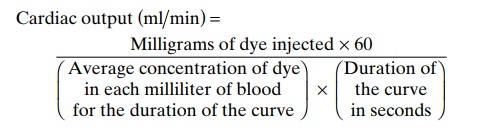
For instance, in the top example of Figure 20–19, this was done by measuring the area under the entire initial and extrapolated curve and then averaging the concentration of dye for the duration of the curve; one can see from the shaded rectangle straddling the curve in the upper figure that the average concentration of dye was 0.25 mg/dl of blood and that the duration of this average value was 12 seconds. A total of 5 mil-ligrams of dye had been injected at the beginning of the experiment. For blood carrying only 0.25 milligram of dye in each deciliter to carry the entire 5 milligrams of dye through the heart and lungs in 12 seconds, a total of 20 1-deciliter portions of blood would have passed through the heart during the 12 seconds, which would be the same as a cardiac output of 2 L/12 sec, or 10 L/min. We leave it to the reader to calculate the cardiac output from the bottomextrapolated curve of Figure 20–19. To summarize, the cardiac output can be determined using the following formula:
Related Topics