Chapter: Medical Physiology: Cardiac Output, Venous Return, and Their Regulation
Venous Return Curves
Venous Return Curves
There remains the entire systemic circulation that must be considered before total analysis of cardiac regulation can be achieved. To analyze the function of the systemic circulation, we first remove the heart and lungs from the circulation of an animal and replace them with a pump and artificial oxygenator system. Then, different factors, such blood volume, vascular resistances, and central venous pressure in the right atrium, are altered to determine how the systemic circulation operates in different circulatory states. In these studies, one finds three principal factors that affect venous return to the heart from the systemic circulation. They are as follows:
1. Right atrial pressure, which exerts a backward forceon the veins to impede flow of blood from the veins into the right atrium.
2. Degree of filling of the systemic circulation (measured by the mean systemic filling pressure), which forces the systemic blood toward the heart (this is the pressure measured everywhere in the systemic circulation when all flow of blood is stopped—we discuss this in detail later).
3. Resistance to blood flow between the peripheralvessels and the right atrium.
These factors can all be expressed quantitatively by the venous return curve, as we explain in the next sections.
Normal Venous Return Curve
In the same way that the cardiac output curve relates pumping of blood by the heart to right atrial pressure, the venous return curve relates venous return also toright atrial pressure—that is, the venousflow of bloodinto the heart from the systemic circulation at different levels of right atrial pressure.
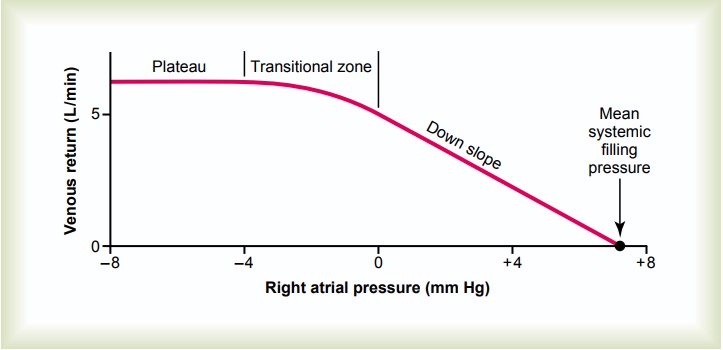
The curve in Figure 20–9 is the normal venous return curve. This curve shows that when heart pumping capa-bility becomes diminished and causes the right atrial pressure to rise, the backward force of the rising atrial pressure on the veins of the systemic circulation decreases venous return of blood to the heart. If allnervous circulatory reflexes are prevented from acting,venous return decreases to zero when the right atrial pressure rises to about +7 mm Hg. Such a slight rise in right atrial pressure causes a drastic decrease in venous return because the systemic circulation is a distensible bag, so that any increase in back pressure causes blood to dam up in this bag instead of returning to the heart.
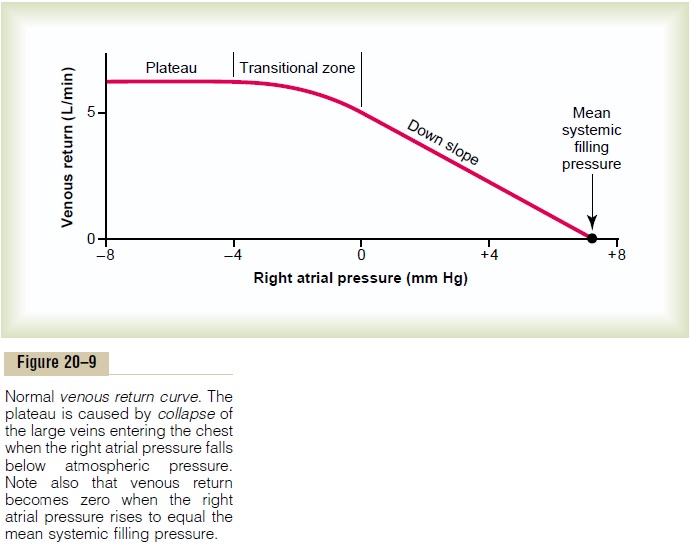
At the same time that the right atrial pressure is rising and causing venous stasis, pumping by the heart also approaches zero because of decreasing venous return. Both the arterial and the venous pressures come to equilibrium when all flow in the systemic circulation ceases at a pressure of 7 mm Hg, which, by definition, is the mean systemic filling pressure (Psf).
Plateau in the Venous Return Curve at Negative Atrial Pressures—Caused by Collapse of the Large Veins. When theright atrial pressure falls below zero—that is, below atmospheric pressure—further increase in venous return almost ceases. And by the time the right atrial pressure has fallen to about -2 mm Hg, the venous return will have reached a plateau. It remains at this plateau level even though the right atrial pressure falls to -20 mm Hg, -50 mm Hg, or even further. This plateau is caused by collapse of the veins entering the chest. Neg-ative pressure in the right atrium sucks the walls of the veins together where they enter the chest, which pre-vents any additional flow of blood from the peripheral veins. Consequently, even very negative pressures in the right atrium cannot increase venous return significantly above that which exists at a normal atrial pressure of 0 mm Hg.
Mean Circulatory Filling Pressure and Mean Systemic Filling Pressure, and Their Effect on Venous Return
When heart pumping is stopped by shocking the heart with electricity to cause ventricular fibrillation or is stopped in any other way, flow of blood everywhere in the circulation ceases a few seconds later. Without blood flow, the pressures everywhere in the circulation become equal. This equilibrated pressure level is called the mean circulatory filling pressure.
Effect of Blood Volume on Mean Circulatory Filling Pressure.
The greater the volume of blood in the circulation, the greater is the mean circulatory filling pressure because extra blood volume stretches the walls of the vascula-ture. The red curve in Figure 20–10 shows the approxi-mate normal effect of different levels of blood volume on the mean circulatory filling pressure. Note that at a blood volume of about 4000 milliliters, the mean circu-latory filling pressure is close to zero because this is the “unstressed volume” of the circulation, but at a volume of 5000 milliliters, the filling pressure is the normal value of 7 mm Hg. Similarly, at still higher volumes, the mean circulatory filling pressure increases almost linearly.
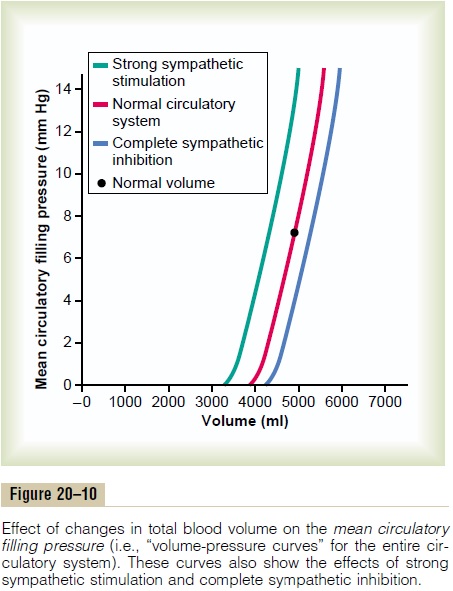
Effect of Sympathetic Nervous Stimulation of the Circulation on Mean Circulatory Filling Pressure. Thegreen curveandbluecurve in Figure 20–10 show the effects, respectively,of high and low levels of sympathetic nervous activity on the mean circulatory filling pressure. Strong sympa-thetic stimulation constricts all the systemic blood vessels as well as the larger pulmonary blood vessels and even the chambers of the heart. Therefore, the capacity of the system decreases, so that at each level of blood volume, the mean circulatory filling pressure is increased. At normal blood volume, maximal sympa-thetic stimulation increases the mean circulatory filling pressure from 7 mm Hg to about 2.5 times that value, or about 17 mm Hg.
Conversely, complete inhibition of the sympathetic nervous system relaxes both the blood vessels and the heart, decreasing the mean circulatory filling pressure from the normal value of 7 mm Hg down to about 4 mm Hg. Before leaving Figure 20–10, note specifically how steep the curves are. This means that even slight changes in blood volume or slight changes in the capacity of the system caused by various levels of sympathetic activity can have large effects on the mean circulatory filling pressure.
Mean Systemic Filling Pressure and Its Relation to Mean Circula- tory Filling Pressure. Themean systemic filling pressure,Psf, is slightly different from the mean circulatory filling pressure. It is the pressure measured everywhere in thesystemic circulation after bloodflow has been stoppedby clamping the large blood vessels at the heart, so that the pressures in the systemic circulation can be meas-ured independently from those in the pulmonary circu-lation. The mean systemic pressure, although almost impossible to measure in the living animal, is the impor-tant pressure for determining venous return. The meansystemic filling pressure, however, is almost always nearly equal to the mean circulatory filling pressure because thepulmonary circulation has less than one eighth as much capacitance as the systemic circulation and only about one tenth as much blood volume.
Effect on the Venous Return Curve of Changes in Mean Systemic Filling Pressure. Figure 20–11 shows the effects on thevenous return curve caused by increasing or decreasing the mean systemic filling pressure (Psf). Note in Figure 20–11 that the normal mean systemic filling pressure is 7 mm Hg. Then, for the uppermost curve in the figure, the mean systemic filling pressure has been increased to 14 mm Hg, and for the lowermost curve, has been decreased to 3.5 mm Hg. These curves demonstrate that the greater the mean systemic filling pressure (which also means the greater the “tightness” with which the circulatory system is filled with blood) the more the venous return curve shifts upward and to the right.
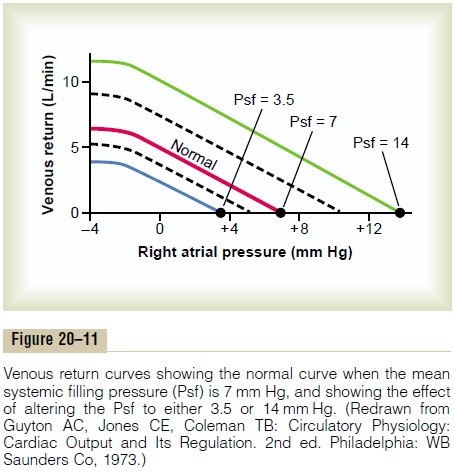
Conversely, the lower the mean systemic filling pressure, the more the curve shifts downward and to the left.
To express this another way, the greater the system is filled, the easier it is for blood to flow into the heart. The less the filling, the more difficult it is for blood to flow into the heart.
“Pressure Gradient for Venous Return”—When This Is Zero, There Is No Venous Return. When the right atrial pressure risesto equal the mean systemic filling pressure, there is no longer any pressure difference between the peripheral vessels and the right atrium. Consequently, there can no longer be any blood flow from any peripheral vessels back to the right atrium. However, when the right atrial pressure falls progressively lower than the mean sys-temic filling pressure, the flow to the heart increases proportionately, as one can see by studying any of the venous return curves in Figure 20–11. That is, the greaterthe difference between the mean systemic filling pressure and the right atrial pressure, the greater becomes the venous return. Therefore, the difference between thesetwo pressures is called the pressure gradient for venousreturn.
Resistance to Venous Return
In the same way that mean systemic filling pressure rep-resents a pressure pushing venous blood from the periphery toward the heart, there is also resistance to this venous flow of blood. It is called the resistance tovenous return. Most of the resistance to venous returnoccurs in the veins, although some occurs in the arteri-oles and small arteries as well.
Why is venous resistance so important in determin-ing the resistance to venous return? The answer is that when the resistance in the veins increases, blood begins to be dammed up, mainly in the veins themselves. But the venous pressure rises very little because the veins are highly distensible. Therefore, this rise in venous pressure is not very effective in overcoming the resist-ance, and blood flow into the right atrium decreases drastically. Conversely, when arteriolar and small artery resistances increase, blood accumulates in the arteries, which have a capacitance only 1/30 as great as that of the veins. Therefore, even slight accumulation of blood in the arteries raises the pressure greatly—30 times as much as in the veins—and this high pressure does over-come much of the increased resistance. Mathematically, it turns out that about two thirds of the so-called “resist-ance to venous return” is determined by venous resist-ance, and about one third by the arteriolar and small artery resistance.
Venous return can be calculated by the following formula:

in which VR is venous return, Psf is mean systemic filling pressure, PRA is right atrial pressure, and RVR is resistance to venous return. In the healthy human adult, the values for these are as follows: venous return equals 5 L/min, mean systemic filling pressure equals 7 mm Hg, right atrial pressure equals 0 mm Hg, and resistance to venous return equals 1.4 mm Hg per liter of blood flow.
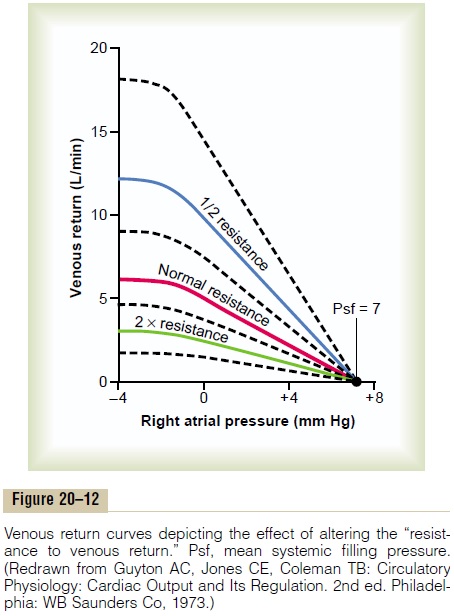
Effect of Resistance to Venous Return on the Venous Return
Curve. Figure 20–12 demonstrates the effect of differentlevels of resistance to venous return on the venous return curve, showing that a decrease in this resistance to one-half normal allows twice as much flow of blood and, therefore, rotates the curve upward to twice as great a slope. Conversely, an increase in resistance to twice normal rotates the curve downward to one-half as great a slope.
Note also that when the right atrial pressure rises to equal the mean systemic filling pressure, venous return becomes zero at all levels of resistance to venous return because when there is no pressure gradient to cause flow of blood, it makes no difference what the resistance is in the circulation; the flow is still zero. Therefore, thehighest level to which the right atrial pressure can rise,regardless of how much the heart might fail, is equal to the mean systemic filling pressure.
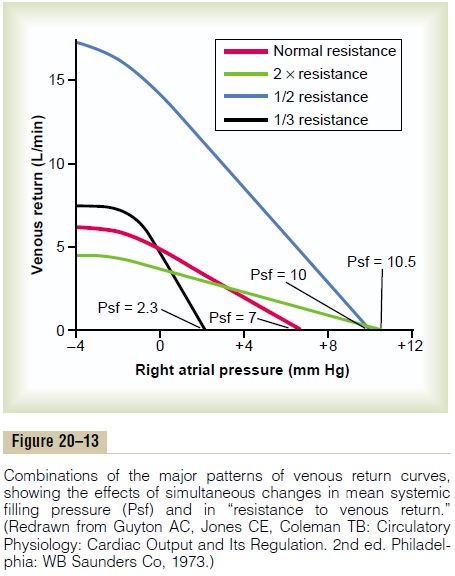
Combinations of Venous Return Curve Patterns. Figure 20–13shows effects on the venous return curve caused by simultaneous changes in mean systemic pressure (Psf) and resistance to venous return, demonstrating that both these factors can operate simultaneously.
Related Topics