Chapter: Clinical Anesthesiology: Anesthetic Management: Respiratory Physiology& Anesthesia
Ventilation/Perfusion Relationships
VENTILATION/PERFUSION RELATIONSHIPS
1. Ventilation
Ventilation is usually measured as the
sum of all exhaled gas volumes in 1 min (minute ventilation, or V ).
Minute ventilation = Respiratory
rate × Tidal volume
For the average adult at rest, minute
ventilation is about 5 L/min.
Not all of the inspired gas mixture
reaches alve-oli; some of it remains in the airways and is exhaled without
being exchanged with alveolar gases. The part of the Vt not participating in
alveolar gas exchange is •known as dead space (Vd). Alveolar
ventilation ( Va) is the volume of inspired gases actu-ally taking
part in gas exchange in 1 min.
Va = Respiratory
rate × Vt − Vd
Dead space is actually composed of gases
in nonrespiratory airways (anatomic dead
space) and
alveoli that are not perfused (alveolar dead space). The sum of the
two components is referred to as physiological
dead space. In the upright position,dead space is normally about 150 mL for
most adults (approximately 2 mL/kg) and is nearly all anatomic. The weight of
an individual in pounds is roughly equivalent to dead space in milliliters.
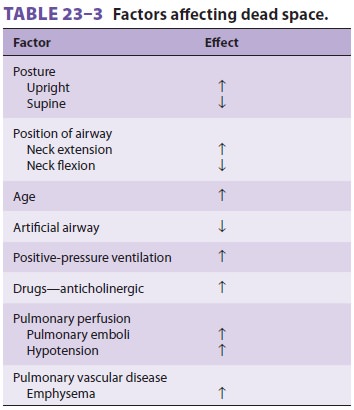
Dead space can be affected by a variety of factors ( Table 23–3).
Because Vt in the average adult is
approxi-mately 450 mL (6 mL/kg), Vd/Vt is normally 33%. This ratio can be
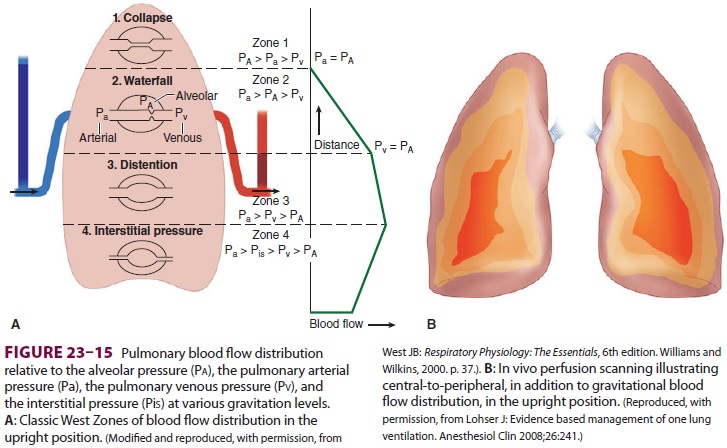
derived by the Bohr equation:
where Paco2
is the alveolar CO2 tension and Peco2 is the mixed expired CO2 tension. This equation is useful clinically if
arterial CO 2 tension (Paco 2) is used to approximate the alveolar concentration
and the CO2 tension in expired air gases is the
average measured over several minutes.
Distribution of Ventilation
Regardless of body position, alveolar
ventila-tion is unevenly distributed in the lungs. The right lung receives more
ventilation than the left lung
(53% vs 47%), and the lower (dependent)
areas of both lungs tend to be better ventilated than do the upper areas
because of a gravitationally induced gra-dient in intrapleural pressure
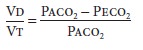
(transpulmonary pres-sure). Pleural pressure decreases about 1 cm H2O (becomes less negative) per 3-cm decrease in lung
height. This difference places alveoli from different areas at different points
on the pulmonary com-pliance curve (Figure 23–14). Because of a higher
transpulmonary pressure, alveoli in upper lung areas are near-maximally
inflated and relatively noncom-pliant, and they undergo little expansion during
inspiration. In contrast, the smaller alveoli in depen-dent areas have a lower
transpulmonary pressure, are more compliant, and undergo greater expansion
during inspiration.
Airway resistance can also contribute to
regional differences in pulmonary ventilation. Final alveolar inspiratory
volume is solely dependent on compliance only if inspiratory time is unlimited.
In reality, inspira-tory time is necessarily limited by the respiratory rate
and the time necessary for expiration; consequently, an excessively short
inspiratory time will prevent alveoli from reaching the expected change in
volume. Moreover, alveolar filling follows an exponential func-tion that is
dependent on both compliance and airway resistance. Therefore, even with a
normal inspiratory time, abnormalities in either compliance or resistance can
prevent complete alveolar filling.
Time Constants
Lung inflation can be described
mathematically by the time constant,
τ.=
Total compliance × Airway
resistance
Regional variations in resistance or
compliance not only interfere with alveolar filling but can cause asynchrony in
alveolar filling during inspiration; some alveolar units may continue to fill
as others empty.
Variations in time constants within the
normal lung can be demonstrated in normal individuals breathing spontaneously
during abnormally high respiratory rates. Rapid shallow breathing reverses the
normal distribution of ventilation, preferentially favoring upper
(nondependent) areas of the lung over the lower areas.
2. Pulmonary Perfusion
Of the approximately 5 L/min of blood
flowing through the lungs, only about 70–100 mL at any one time are within the
pulmonary capillaries undergo-ing gas exchange. At the alveolar–capillary
mem-brane, this small volume forms a 50–100 m2-sheet
of blood approximately one red cell thick. Moreover, to ensure optimal gas
exchange, each capillary perfuses more than one alveolus.
Although capillary volume remains
relatively constant, total pulmonary blood volume can vary between 500 mL and
1000 mL. Large increases in either cardiac output or blood volume are tolerated
with little change in pressure as a result of passive dilation of open vessels
and perhaps some recruit-ment of collapsed pulmonary vessels. Small increases
in pulmonary blood volume normally occur during cardiac systole and with each
normal (spontaneous) inspiration. A shift in posture from supine to erect
decreases pulmonary blood volume (up to 27%); Trendelenburg positioning has the
opposite effect. Changes in systemic capacitance also influence pulmonary blood
volume: systemic venoconstriction shifts blood from the systemic to the
pulmonary circulation, whereas vasodilation causes a pulmonary-to-systemic
redistribution. In this way, the lung acts as a reservoir for the systemic
circulation.
Local factors are more important than
the autonomic system in influencing pulmonaryvascular tone (above). Hypoxia is
a powerful stimu-lus for pulmonary vasoconstriction (the opposite of its
systemic effect). Both pulmonary arterial (mixed venous) and alveolar hypoxia
induce vasoconstric-tion, but the latter is a more powerful stimulus. This
response seems to be due to either the direct effect of hypoxia on the
pulmonary vasculature or increased production of leukotrienes relative to
vasodilatory prostaglandins. Inhibition of nitric oxide production may also
play a role. Hypoxic pulmonary vasocon-striction is an important physiological
mechanism in reducing intrapulmonary shunting and prevent-ing hypoxemia .
Hyperoxia has little effect on the pulmonary circulation in normal
indi-viduals. Hypercapnia and acidosis have a constrictor effect, whereas
hypocapnia causes pulmonary vaso-dilation, the opposite of what occurs in the
systemic circulation.
Distribution of Pulmonary Perfusion
Pulmonary blood flow is also not
uniform. Regardless of body position, lower (dependent) areas of the lung
receive greater blood flow than upper (nondependent) areas. This pattern is the
result of a gravitational gradient of 1 cm H 2O/cm
lung height. The normally low pressures in the pulmonary circu-lation allow
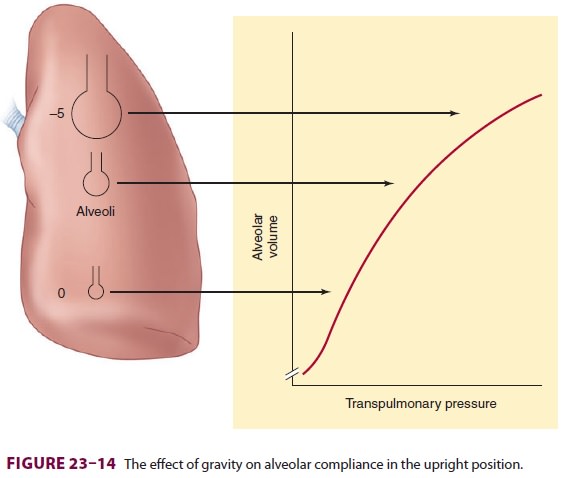
gravity to exert a significant influence on blood flow. Also, in vivo perfusion
scanning in normal individuals has shown an “onion-like” layer-ing distribution
of perfusion, with reduced flow at the periphery of the lung and increased
perfusion toward the hilum.
Although the pulmonary perfusion
pressure is not uniform across the lung, the alveolar distending pressure is
relatively constant. The interplay of these pressures results in the dividing
of the lung into four distinct zones (ie, the West Zones) (Figure 23–15). In zone 1 (Pa > Pa > Pv), alveolar
pressure (Pa) is greater than both the arterial pulmonary pressure (Pa) and
venous pulmonary pressure (Pv), resulting in obstruction of blood flow and
creation of alveolar dead space. Zone 1 is fairly small in a spontaneously
breathing individual, but can enlarge during positive pressure ventilation. In
lower areas of the lungs, Pa progressively increases due to lower elevation
above the heart. In zone 2 (Pa > Pa > Pv), Pa is higher than Pa, but Pv remains lower
than both, resulting in blood flow that is dependent on the differential
between Pa and Pa. The bulk of the lung is described by zone 3 (Pa > Pv > Pa), where both
Pa and Pv are higher than Pa, resulting in blood flow independent of the
alveolar pressure. Zone 4, the most dependent part of the lung, is where
atelectasis and/or intersti-tial pulmonary edema occur, resulting in blood flow
that is dependent on the differential between Pa and pulmonary interstitial
pressure.
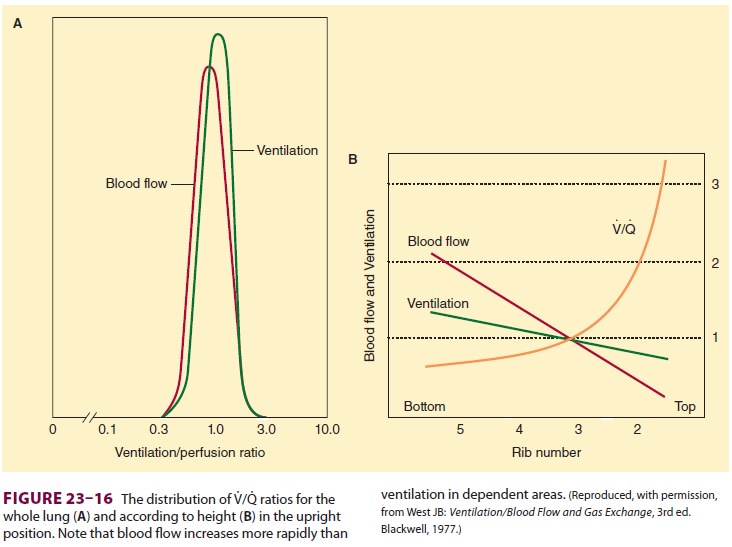
Ventilation/Perfusion Ratios
Because alveolar ventilation (Va)
is normally•about 4 L/min, and pulmonary capillary perfusion (Q) is 5 L/min,
the overall V/Q ratio is about0.8. V/Q for individual lung units (each
alveolus and its capillary) can range from 0 (no ventilation) to infinity (no
perfusion); the former is referred to as intrapulmonary shunt, whereas the
latter constitutes alveolar dead space. V/Q normally ranges between 0.3 and 3.0;
the majority of lung areas, however, are close to 1.0 (Figure 23–16A). Because
perfusion increases at a greater rate than ventilation, nondependent (apical)
areas tend to have higher V/Q ratios than do dependent (basal) areas
( Figure
23–16B).The importance of V/Q ratios relates to the efficiency with
which lung units resaturate venous blood with O 2
and eliminate CO2. Pulmonary
venous blood (the effluent) from areas with lowV/Q
ratios has a low O2tension and high CO2ten-sion—similar
to systemic mixed venous blood.Blood from these units tends to depress arterial
O2 tension and elevate arterial CO 2 tension. Their effect on arterial O2 tension is much more profound than that on CO2 tension; in fact, arterial CO 2 tension often decreases from a hypoxemia-induced
reflex increase in alveolar ventilation. An appreciable com-pensatory increase
in O uptake cannot take place in remaining areas where V/Q is normal, because pulmonary
end-capillary blood is usually already maximally saturated with O2 .
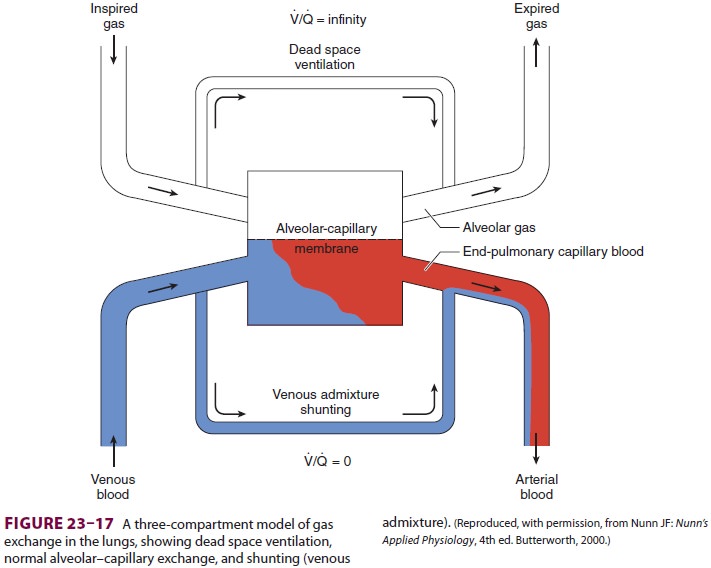
3. Shunts
Shunting denotes the process whereby
desat-urated, mixed venous blood from the rightheart returns to the left heart
without being resat-urated with O2 in the lungs (Figure 23–17). The overall
effect of shunting is to decrease (dilute) arte-rial O 2 content; this type of shunt is referred to as
right-to-left. Left-to-right shunts (in the absence of
pulmonary congestion), however, do not
produce hypoxemia.
Intrapulmonary shunts are often
classified as absolute or relative. Absolute shunt refers to anatomic shunts
and lung units where V/Q is zero. A relative shunt is an area of
the lung with a low V/Q ratio. Clinically, hypoxemia from a relative shunt
can usually be partially corrected by increasing the inspired O 2 concentration; hypoxemia caused by an absolute
shunt cannot.
Venous Admixture
Venous admixture refers to a concept
rather than an actual physiological entity. Venous admixture is the amount of mixed venous blood that would
have to be mixed with pulmonary end-capillary blood to account for the
difference in O2 tension between arte-rial and pulmonary
end-capillary blood. Pulmonary end-capillary blood is considered to have the
same concentrations as alveolar gas. Venous admixture is usually expressed as a
fraction of total cardiac output
(Qs/Qt ). The
equation for Qs/Qt may be derived with the law for the
conservation of mass for O2 across the pulmonary bed:
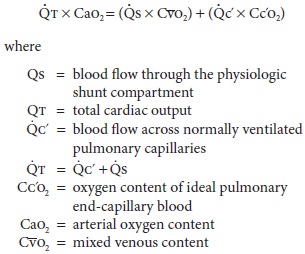
The simplified equation is
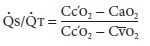
The formula for calculating the O 2 content of blood is given below.
Qs/Qt can
be calculated clinically by obtainingmixed venous and arterial blood gas
measurements; the former requires a pulmonary artery catheter. The alveolar gas
equation is used to derive pulmo-nary end-capillary O 2 tension. Pulmonary capillary blood is usually
assumed to be 100% saturated for an Fio2≥
0.21.
The calculated venous admixture assumes
that all shunting is intrapulmonary and due to absolute shunts (V/Q= 0). In reality,
neither is ever the case; nonetheless, the concept is useful clinically. Normal
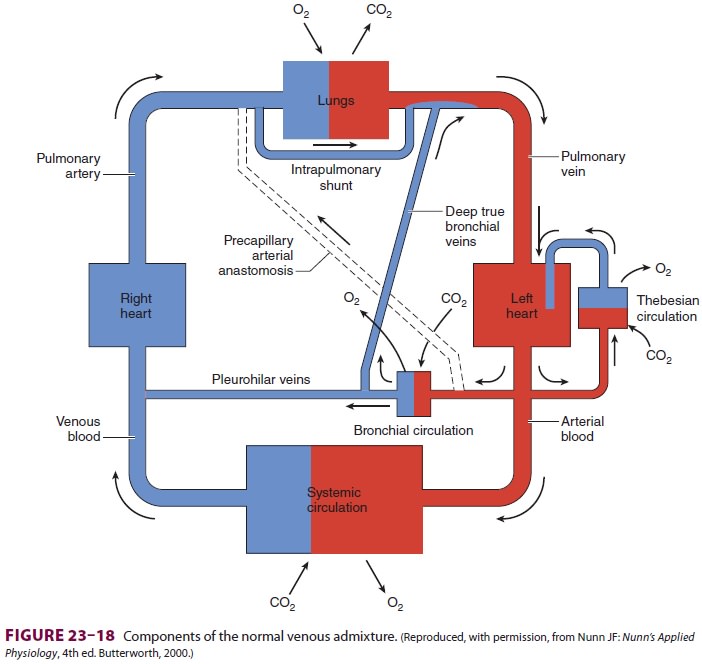
Qs/Qt is primarily due to communication betweendeep
bronchial veins and pulmonary veins, the the besian circulation in the heart,
and areas of low V/Q in the lungs (Figure 23–18). The venous admixture in normal
individuals (physiological shunt) is typi-cally less than 5%.
4. Effects of Anesthesia on Gas Exchange
Abnormalities in gas exchange during anesthesia are common. They include increased dead space, hypoventilation, and increased intrapulmonary shunting. There is increased scatter of V/Q ratios. Increases in alveolar dead space are most commonly seen during controlled ventilation, but may also occur during spontaneous ventilation. General anesthesia commonly increases venous admixture to 5% to 10%, probably as a result of atelectasis and airway collapse in dependent areas of the lung. Inhalation agents, including nitrous oxide, also can inhibit hypoxic pulmonary vasoconstriction in high doses; for volatile agents, the ED 50 is about 2minimum alveolar concentration (MAC). Elderly patients seem to have the largest increases in Qs/Qt. Inspired O 2 tensions of 30% to 40% usually prevent hypoxemia, suggesting anesthesia increases relative shunt. PEEP is often effective in reducing venous admixture and preventing hypoxemia during gen-eral anesthesia, as long as cardiac output is main-tained Prolonged administration of high inspired O2 concentrations may be associated with atelecta-sis formation and increases in absolute shunt.
Atelectasis in this situation is known
as resorption atelectasis and appears in areas with a low V/Q
ratio ventilated at an O 2-inspired concentration close to 100%.
Perfusion results in O2 being trans-ported out of the alveoli
at a rate faster than it enters the alveoli, leading to an emptying of the
alveoli and collapse.
Related Topics