Chapter: Clinical Anesthesiology: Anesthetic Management: Respiratory Physiology& Anesthesia
Transport of Respiratory Gases in Blood
TRANSPORT OF RESPIRATORY GASES IN BLOOD
1. Oxygen
O2
is carried in blood in two forms: dissolved in solu-tion and in reversible
association with hemoglobin.
Dissolved Oxygen
The amount of O2 dissolved in blood can be derived from Henry’s law, which states that the
concen-tration of any gas in solution is proportional to its partial pressure.
The mathematical expression is as follows:
Gas concentration = α ×
Partial pressure
where α
= the gas solubility
coefficient for a given solution at a given temperature.
The solubility coefficient for O2 at normal body temperature is 0.003 mL/dL/mm Hg.
Even with a Pao2 of 100 mm Hg, the maximum amount of O2 dissolved in blood is very small (0.3 mL/dL)
com-pared with that bound to hemoglobin.
Hemoglobin
Hemoglobin is a complex molecule
consisting of four heme and four protein subunits. Heme is an iron–porphyrin
compound that is an essen-tial part of the O 2-binding
sites; only the divalent form (+2 charge) of iron can bind O2. The normal hemoglobin molecule (hemoglobin A1) consists of two α and two β chains (subunits); the four subunits
are held together by weak bonds between the amino acid residues. Each gram of
hemoglobin can theo-retically carry up to 1.39 mL of O 2.
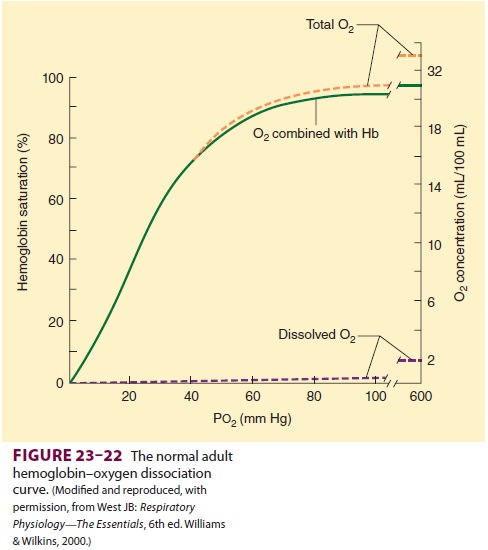
Hemoglobin Dissociation Curve
Each hemoglobin molecule binds up to
four O2 molecules. The complex interaction
between the hemoglobin subunits results in nonlinear (an elon-gated S shape)
binding with O2 (Figure 23–22). Hemoglobin saturation is the
amount of O2 bound as a percentage of its total O 2-binding capacity. Four separate chemical reactions
are involved in bind-ing each of the four O2
molecules. The change in molecular conformation induced by the binding of the
first three molecules greatly accelerates bind-ing of the fourth O2 molecule. The last reaction is responsible for the
accelerated binding between 25% and 100% saturation. At about 90% saturation,
the decrease in available O2 receptors flattens the curve until full
saturation is reached.
Factors Influencing the Hemoglobin Dissociation Curve
Clinically
important factors altering O2 binding include hydrogen ion
concentration, CO2 tension, temperature, and 2,3-diphosphoglycerate
(2,3-DPG) concentration. Their effect on hemoglobin–O2 inter-action
can be expressed by P50, the O2 tension at which
hemoglobin is 50% saturated (Figure 23–23). Each factor shifts the
dissociation curve either to the right (increasing P50) or to the
left (decreasing P50).
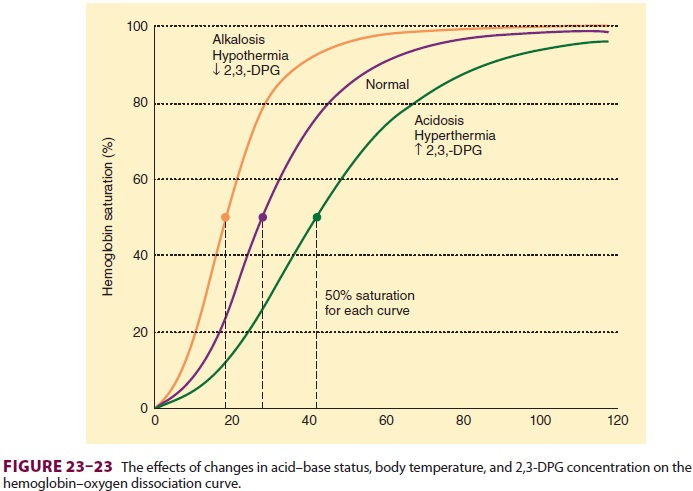
A
rightward shift in the oxygen–hemoglobin dissociation curve lowers O 2
affinity, displacesO2 from hemoglobin, and makes more O2
available to tissues; a leftward shift increases hemoglobin’s affinity for O 2,
reducing its availability to tissues. The normal P 50 in adults is
26.6 mm Hg (3.4 kPa).An increase in blood hydrogen ion concen-tration reduces O
2 binding to hemoglobin (Bohr effect). Because of the shape of the hemoglobindissociation curve, the
effect is more important in venous blood than arterial blood (Figure 23–23);
the net result is facilitation of O2 release to tissue with little
impairment in O2 uptake (unless severe hypoxia is present).
The
influence of CO2 tension on hemoglobin’s affinity for O 2
is important physiologically and is secondary to the associated rise in
hydrogen ion concentration when CO2 tension increases. The high CO2
content of venous capillary blood, by decreasing hemoglobin’s affinity for O 2,
facilitates the release of O2 to tissues; conversely, the lower CO2
content in pulmonary capillaries increases hemoglobin’s affin-ity for O2
again, facilitating O2 uptake from alveoli.
2,3-DPG
is a by-product of glycolysis (the Rapoport–Luebering shunt) and accumulates
dur-ing anaerobic metabolism. Although its effects on hemoglobin under these
conditions are theoreti-cally beneficial, its physiological importance
nor-mally seems minor. 2,3-DPG levels may, however, play an important
compensatory role in patientswith chronic anemia and may significantly affect
the O2-carrying capacity of blood transfusions.
Abnormal Ligands & Abnormal Forms of Hemoglobins
Carbon
monoxide, cyanide, nitric acid, and ammo-nia can combine with hemoglobin at O2-binding
sites. They can displace O 2 and shift the saturation curve to the
left. Carbon monoxide is particularly potent, having 200–300 times the affinity
of O2 for hemoglobin, combining with it to form carboxyhe-moglobin.
Carbon monoxide decreases hemoglo-bin’s O2-carrying capacity and
impairs the release of O2 to tissues.
Methemoglobin
results when the iron in heme is oxidized to its trivalent (+3)
form. Nitrates, nitrites, sulfonamides, and other drugs can rarely result in
significant methemoglobinemia. Methemoglobin cannot combine with O2
unless reconverted by the enzyme methemoglobin reductase; methemoglo-bin also
shifts the normal hemoglobin saturation curve to the left. Methemoglobinemia,
like car-bon monoxide poisoning, therefore decreases the O2-carrying
capacity and impairs the release of O 2. Reduction of methemoglobin
to normal hemoglo-bin is facilitated by such agents as methylene blue or
ascorbic acid.
Abnormal
hemoglobins can also result from variations in the protein subunit composition.
Each variant has its own O2-saturation characteristics. These
include fetal hemoglobin, hemoglobin A2, and sickle hemoglobin.
Oxygen Content
The
total O2 content of blood is the sum of that in solution plus that carried by
hemoglobin. In reality, O2 binding to hemoglobin never achieves the theoretical
maximum (see above), but is closer to 1.31 mL O2/dL blood per mm Hg.
Total O2 content is expressed by the following equation:
O2
content = ([0.003 mL O2/dL blood
per mm Hg]
Po2)
+
(So2× Hb ×
1.31 mL/dL blood)
where
Hb is hemoglobin concentration in g/dL blood, and So2 is hemoglobin
saturation at the given Po2. Using the above formula and a
hemoglobin of 15 g/dL, the normal O 2 content for both arterial and
mixed venous blood and the arteriovenous differ-ence can be calculated as
follows:
Cao2
= (0.003 × 100) + (0.975 × 15 × 1.39)
=
19.5 mL/dL blood
Cvo2
= (0.003 × 40) + (0.75 × 15 × 1.31)
= 14.8 mL/dL blood
Cao2
− Cvo2 = 4.7 mL/dL blood
Oxygen Transport
O2
transport is dependent on both respiratory and circulatory function. Total O 2
delivery (Do2)
to tis-sues is the product of arterial O2 content and cardiac
output:
Do2
= Cao2 × Qt
Note
that arterial O 2 content is dependent on Pao2 as well as
hemoglobin concentration. As aresult, deficiencies in O2delivery
may be due to a low Pao2, a low hemoglobin concentration, or an inadequate
cardiac output. Normal O 2 delivery canbe calculated as follows:
O2
delivery = 20 mL O2/dL blood× 50
dL per blood/min
1000
mL O2/min
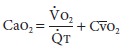
The
Fick equation expresses the relationship between O2 consumption, O2
content, and cardiac output:

Rearranging
the equation:
Consequently,
the arteriovenous difference is a good measure of the overall adequacy of O2
delivery.As calculated above, the arteriovenous difference (Cao2−Cvo2)
is about 5 mL O2/dL blood (20 mL O2/ dL – 15 mL O2/dL).
Note that the normal extraction fraction for O2[(Cao2−Cvo2)/Cao2]
is 5 mL ÷ 20 mL, or 25%; thus, the body
normally consumes only 25% of the O2 carried on hemoglobin. When O2
demand exceeds supply, the extraction fraction exceeds 25%. Conversely, if O2
supply exceeds demand, the extrac-tion fraction falls below 25%.When Do2 is even moderately reduced, Vo2extraction (mixed
venous O saturation decreases); Vo2
remains independentof delivery. With fur ther reductions in Do2,
however, a critical point is reached beyond which Vo2 becomes directly proportional to Do2. This
state of supply-dependent O2 is typically associated with progressive lactic
acidosis caused by cellular hypoxia.
Oxygen Stores
The
concept of O2 stores is important in anesthesia. When the normal
flux of O2 is interrupted by apnea, existing O2 stores
are consumed by cellular metabo-lism; if stores are depleted, hypoxia and
eventual cell death follow. Theoretically, normal O2 stores in
adults are about 1500 mL. This amount includes the O2 remaining in
the lungs, that bound to hemoglobin (and myoglobin), and that dissolved in body
fluids. Unfortunately, the high affinity of hemoglobin for O2 (the
affinity of myoglobin is even higher), and the very limited quantity of O2
in solution, restrict the availability of these stores. The O2
contained within the lungs at FRC (initial lung volume during apnea),
therefore, becomes the most important source of O2. Of that volume,
however, probably only 80% is usable. Apnea in a patient previously breathing
room air leaves approximately 480 mL of O2 in the lungs. (If Fio2 = 0.21 and FRC
= 2300 mL, O2 content = Fio2 × FRC.) The metabolic activity of tissues rapidly
depletes• this reservoir (presumably at a rate equiva-lent to Vo2); severe
hypoxemia usually occurs within 90 sec. The onset of hypoxemia can be delayed
by increasing the Fio2 prior to the apnea. Following ven-tilation with 100% O2,
FRC contains about 2300 mL of O2; this delays hypoxemia following apnea for 4–5
min. This concept is the basis for preoxygenation prior to induction of
anesthesia.
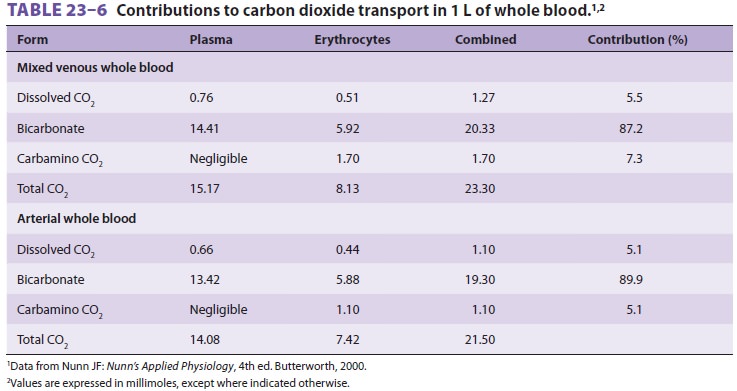
2. Carbon Dioxide
Carbon dioxide is transported in blood
in three forms: dissolved in solution, as bicarbonate, and with proteins in the
form of carbamino compounds (Table23–6).
The sum of all three forms is the total CO2
content of blood (routinely reported with elec-trolyte measurements).
Dissolved Carbon Dioxide
Carbon dioxide is more soluble in blood than O2, with a solubility coefficient of 0.031 mmol/L/mm Hg (0.067 mL/dL/mm Hg) at 37°C.
Bicarbonate
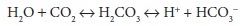
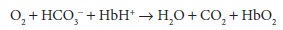
In
aqueous solutions, CO 2 slowly combines with water to form carbonic
acid and bicarbonate, according to the following reaction:
In
plasma, although less than 1% of the dis-solved CO2 undergoes this reaction,
the presence of the enzyme carbonic anhydrase within erythro-cytes and
endothelium greatly accelerates the reaction. As a result, bicarbonate
represents the largest fraction of the CO 2 in blood (see
Table
23–6). Administration of acetazolamide, a car-bonic anhydrase inhibitor, can
impair CO2 transport between tissues and alveoli.
On
the venous side of systemic capillaries, CO2 enters red blood cells
and is converted to bicar-bonate, which diffuses out of red cells into plasma;
chloride ions move from plasma into red cells to maintain electrical balance.
In the pulmonary capil-laries, the reverse occurs: chloride ions move out of
red cells as bicarbonate ions reenter them for con-version back to CO2,
which diffuses out into alve-oli. This sequence is referred to as the chloride
or Hamburger shift.
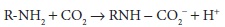
Carbamino Compounds
Carbon
dioxide can react with amino groups on proteins, as shown by the following
equation:
At
physiological pH, only a small amount of CO2 is carried in this
form, mainly as carbamino-hemoglobin. Deoxygenated hemoglobin (deoxy-hemoglobin)
has a greater affinity (3.5 times) for CO2 than does oxyhemoglobin.
As a result, venous blood carries more CO 2 than does arterial blood
(Haldane effect; see Table 23–6). Pco2 normally has little effect on
the fraction of CO2carried as carbaminohemoglobin.
Effects of Hemoglobin Buffering on Carbon Dioxide Transport
The
buffering action of hemoglobin also accounts for part of the Haldane effect.
Hemoglobin can act as a buffer at physiological pH because of itsChigh content
of histidine. Moreover, the acid–base behavior of hemoglobin is influenced by
its oxy-genation state:
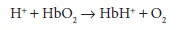
Removal
of O 2 from hemoglobin in tissue cap-illaries causes the hemoglobin
molecule to behave more like a base; by taking up hydrogen ions, hemo-globin
shifts the CO2–bicarbonate equilibrium in favor of greater
bicarbonate formation:
As
a direct result, deoxyhemoglobin also increases the amount of CO2
that is carried in venous blood as bicarbonate. As CO2 is taken up
from tissue and converted to bicarbonate, the total CO2 content of
blood increases (see Table 23–6).
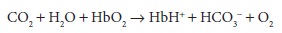
In
the lungs, the reverse is true. Oxygenation of hemoglobin favors its action as
an acid, and the release of hydrogen ions shifts the equilibrium in favor of
greater CO 2 formation:
Bicarbonate
concentration decreases as CO 2 is formed and eliminated, so that
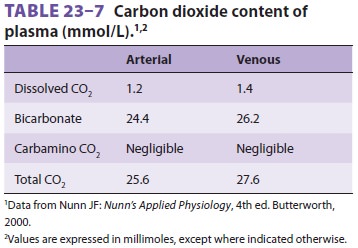
the total CO2 content of blood decreases in the lungs. Note that
there is a difference between CO2 content (concentration per liter)
of whole blood (see Table 23–6) and plasma (Table23–7).
Carbon Dioxide Dissociation Curve
A
CO2 dissociation curve can be constructed by plotting the total CO 2
content of blood against Pco2.
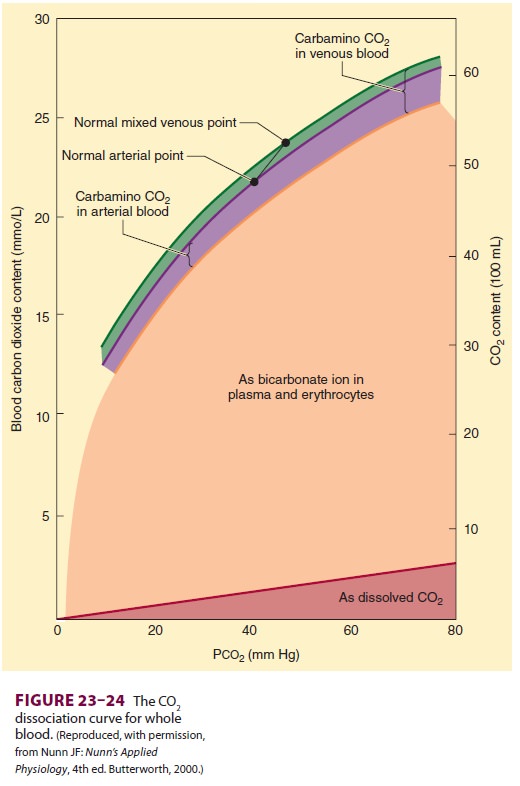
The
contribution of each form of CO2 can also be quantified in this
manner (Figure23–24).
Carbon Dioxide Stores
Carbon
dioxide stores in the body are large (approximately 120 L in adults) and
primarily in the form of dissolved CO 2 and bicarbonate. When an
imbalance occurs between production and elimination, establishing a new CO2
equi-librium requires 20–30 min (compared with less than 4–5 min for O2;
see above). Carbon dioxide is stored in the rapid-, intermediate-, and
slow-equilibrating compartments. Because of the largercapacity of the
intermediate and slow compart-ments, the rate of rise in arterial CO2
tension is generally slower than its fall following acute changes in
ventilation.
Related Topics