Statistics - Types of Tables | 11th Statistics : Chapter 3 : Classification and Tabulation of Data
Chapter: 11th Statistics : Chapter 3 : Classification and Tabulation of Data
Types of Tables
Types of
Tables
Statistical
tables can be classified under two general categories, namely, general tables
and summary tables.
General
tables contain a collection of detailed information including all that is
relevant to the subject or theme. The main purpose of such tables is to present all the information available on a certain problem at one place
for easy reference and they are usually placed in the appendices of reports.
Summary
tables are designed to serve some specific purposes. They are smaller in size
than general tables, emphasize on some aspect of data and are generally
incorporated within the text. The summary tables are also called derivative tables because
they are derived from the general tables. The information contained
in the summary table aims at analysis and inference. Hence, they are also known
as interpretative tables.
The
statistical tables may further be classified into two broad classes namely
simple tables and complex tables. A simple table summarizes information on a
single characteristic and is also called a univariate table.
Example 3.8
The
marks secured by a batch of students in a class test are displayed in Table 3.8
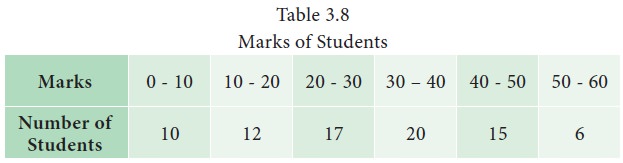
This
table is based on a single characteristic namely marks and from this table one
may observe the number of students in each class of marks. The questions such
as the number of students scored in the range 50 – 60, the maximum number of
students in a specific range of marks and so on can be determined from this
table.
A
complex table summarizes the complicated information and presents them into two
or more interrelated categories. For example, if there are two coordinate
factors, the table is called a two-way table or bi-variate table; if the number
of coordinate groups is three, it is a case of three-way tabulation, and if it
is based on more than three coordinate groups, the table is known as higher
order tabulation or a manifold tabulation.
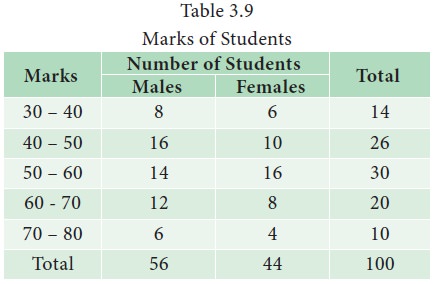
Example 3.9
Table
3.9 is an illustration for a two-way table, in which there are two
characteristics, namely, marks secured by the students in the test and the
gender of the students. The table provides information relating to two
interrelated characteristics, such as marks and gender of students. It is
observed from the table that 26 students have scored marks in the range 40 – 50
and among them students, 16 are males and 10 are females.
Example 3.10
Table
3.10 is an example for a three – way table with three factors, namely, marks,
gender and location.
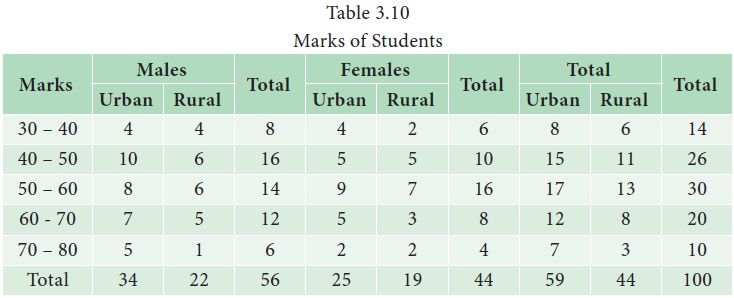
From
this table, one may get information relating to the distribution of students
according marks, gender and geographical location from where they hail.
Related Topics