Chapter: 11th Statistics : Chapter 3 : Classification and Tabulation of Data
Stem and Leaf Plot (Stem and Leaf Diagram)
Stem and Leaf Plot (Stem and Leaf Diagram )
The
stem and leaf plot is another method of
organizing data and is a combination of sorting and graphing. It is an
alternative to a tally chart or a grouped frequency distribution. It retains
the original data without loss of information. This is also a type of bar
chart, in which the numbers themselves would form the bars.
Stem and leaf plot is a type of data
representation for numbers, usually like a table with two columns. Generally, stem
is the label for left
digit (leading digit)
and leaf is the label for the right digit (trailing digit) of a number.
For
example, the leaf corresponding to the value 63 is
3. The digit to the left of the leaf is called the stem. Here the stem
of 63 is 6. Similarly for the
number 265, the
leaf is 5 and
the stem is 26.
The
elements of data 252, 255, 260, 262, 276, 276, 276, 283, 289, 298 are expressed
in Stem and leaf
plot as follows:
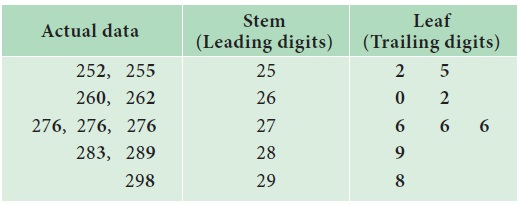
From
the Stem and Leaf plot, we find easily the smallest number is 252 and the largest
number is 298.
Also,
in the class 270 – 280 we find 3 items are included and that group has the
highest frequency.
The
procedure for plotting a Stem and Leaf diagram is illustrated through an
example given below:
Example 3.17
Construct
a Stem and Leaf plot for the given data.
1.13,
0.72, 0.91, 1.44, 1.03, 0.88, 0.99, 0.73, 0.91, 0.98, 1.21, 0.79, 1.14, 1.19,
1.08, 0.94, 1.06, 1.11, 1.01
Solution:
Step 1: Arrange the data in the ascending order of magnitude:
0.72,
0.73, 0.79, 0.88, 0.91, 0.94, 0.98, 0.99, 1.01,
1.03,
1.06, 1.08, 1.11, 1.13, 1.14, 1.19, 1.21, 1.39, 1.44
Step 2: Separate the data according to the first digit as shown
0.72,
0.73, 0.79
0.88
0.91,
0.91, 0.94, 0.98,
0.99
1.01,
1.03, 1.06, 1.08
1.11,
1.13, 1.14, 1.19
1.21
1.39
1.44
Step 3: Now construct the stem and leaf
plot for the above data.
Stem
(Leading digits)
Stem
(Leading digits)
0.7
0.8
0.9
1.0
1.1
1.2
1.3
1.4
Leaves
(Trailing digits )
2 3 9
8
1 1 4 8 9
1 3 6 8
1 3 4 9
1
9
4
Using a Stem and Leaf plot, finding the Mean, Median, Mode and Range
We
know how to create a stem and leaf plot. From this display, let us look at how
we can use it to analyze data and draw conclusions. First, let us recall some
statistical terms already we used in the earlier classes.
·
The
mean is the data value which gives the sum of all the data values, divided by
the number of data values.
·
The
median is the data value in the middle when the data is ordered from the
smallest to the largest.
·
The
mode is the data value that occurs most often. On a stem and leaf plot, the
mode is the repeated leaf.
·
The
range is the difference between the highest and the least data value.
Example 3.18
Determine
the mean, median, mode and the range on the stem and leaf plot given below:
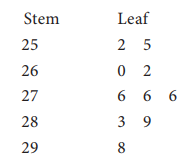
Solution:
From
the display, combine the stem with each of its leaves. The values are in the
order from the smallest to the largest on the plot. Therefore, keep them in
order and list the data values as follows:
252,
255, 260, 262, 276, 276, 276, 283, 289, 298
To
determine the mean, add all the data values and then divide the sum by the
number of data values.
(252
+ 255 + 260 + 262 + 276 + 276 + 276 + 283 + 289 + 298) ÷ 10
=2727
÷ 10 = 272.7
Mean
= 272.7.
The
data is already arranged in ascending order. Therefore, identify the number in
the middle position of the data. In this case, two data values share the middle
position. To find the median, find the mean of these two middle data values.
The
two middle numbers are 276 and 27 6.
The
median is ( 276 +276 ) ÷ 2 = 276.
The
mode is the data value that occurs more frequently. Looking at the stem and
leaf plot, we can see the data value 276 appears thrice.
Therefore
the mode is 276.
Recall
that the range is the difference of the greatest and least values. On the stem
and leaf plot, the greatest value is the last value and the smallest value is
the first value.
The
range is 298 – 252 = 46.
Related Topics