Classification of Data | Statistics - Types of Classification | 11th Statistics : Chapter 3 : Classification and Tabulation of Data
Chapter: 11th Statistics : Chapter 3 : Classification and Tabulation of Data
Types of Classification
Types of
Classification
The
raw data can be classified in various ways depending on the nature of data. The
general types of classification are: (i) Classification by Time or
Chronological Classification
(i) Classification
by Space or Spatial Classification (iii) Classification by Attribute or
Qualitative Classification and (iv) Classification by Size or Quantitative
Classification. Each of these types is now described.
Classification by Time or Chronological Classification
The
method of classifying data according to time component is known as
classification by time or chronological classification. In this type of
classification, the groups or classes are arranged either in the ascending
order or in the descending order with reference to time such as years,
quarters, months, weeks, days, etc. Illustrations for statistical data to be
classified under this type are listed below:
·
Number
of new schools established in Tamil Nadu during 1995 – 2015
·
Pass
percentage of students in SSLC Board Examinations over a period of past 5 years
·
Index
of market prices in stock exchanges arranged day-wise
·
Month-wise
salary particulars of employees in an industry
·
Particulars
of outpatients in a Primary Health Centre presented day-wise.
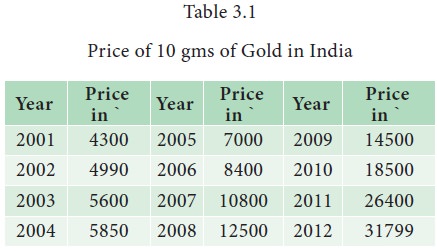
Example 3.1
The
classification of data relating to the price of 10 gms of gold in India during
2001 - 2012 is given in Table 3.1
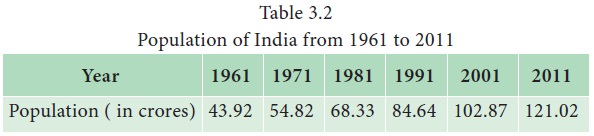
Example 3.2
The
classification of data relating to the population of India from 1961 to 2011 is
provided in Table 3.2:
Classification by Space (Spatial) or Geographical Classification
The
method of classifying data with reference to geographical location such as
countries, states, cities, districts, etc., is called classification by space
or spatial classification. It is also termed as geographical classification.
The following are some examples:
·
Number
of school students in rural and urban areas in a State
·
Region-wise
literacy rate in a state
·
State-wise
crop production in India
·
Country-wise
growth rate in South East Asia
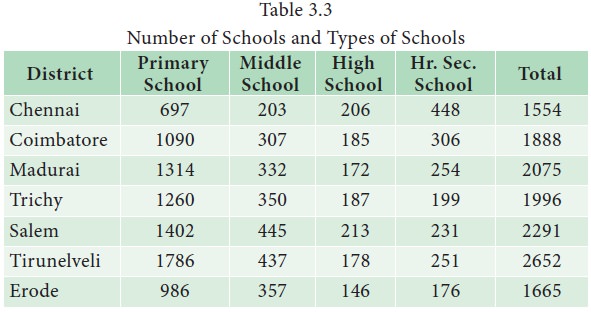
Example 3.3
The
classification of data relating to number of schools and types of schools in 7
major cities of Tamil Nadu as per the Annual Budget Report 2012 – 2013 is given
in Table 3.3
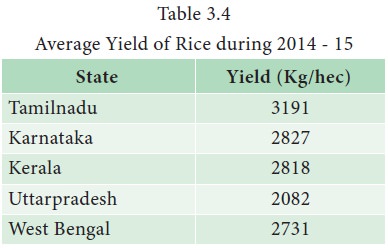
Example 3.4
Average
yield of rice (Kg/hec) during 2014-15 as per the records of Directorate of
Economics and Statistics, Ministry of Agriculture and Farmers Welfare,
Government of India, in five states in India is given in Table 3.4
Classification by Attributes or Qualitative classification
The
method of classifying statistical data on the basis of attribute is said to be
classification by attributes or qualitative classification. Examples of
attributes include nationality, religion, gender, marital status, literacy and
so on.
Classification
according to attributes is of two kinds: simple classification and manifold
classification.
In
simple classification the raw data are classified by a single attribute. All
those units in which a particular characteristic is present are placed in one
group and others are placed in another group. The classification of individuals
according to literacy, gender, economic status would come under simple
classification.
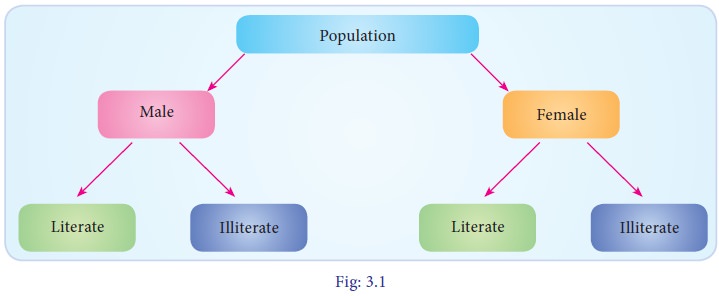
In
manifold classification, two or more attributes are considered simultaneously.
When more attributes are involved, the data would be classified into several
classes and subclasses depending on the number of attributes. For example,
population in a country can be classified in terms of gender as male and
female. These two sub-classes may be further classified in terms of literacy as
literate and illiterate.
While
classifying the data according to attributes, it is essential to ensure that
the attributes involved have to be defined without ambiguity. For example,
while classifying income groups, the investigator has to define carefully the
different non-overlapping income groups.
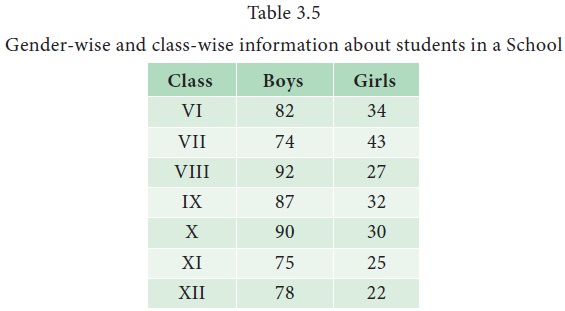
Example 3.5
The
classification of students studying in a school according to gender is given in
Table 3. 5
Classification by Size or Quantitative Classification
When
the characteristics are measured on numerical scale, they may be classified on
the basis of their magnitude. Such a classification is known as classification
by size or quantitative classification. For example data relating to the
characteristics such as height, weight, age, income, marks of students,
production and consumption, etc., which are quantitative in nature, come under
this category.
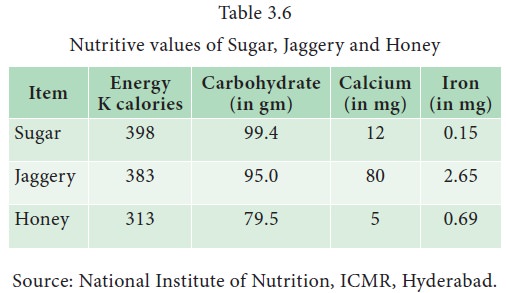
Example 3.6
The
classification of data relating to nutritive values of three items measured per
100 grams is provided in Table 3.6
In
the classification of data by size, data may also be classified deriving number
of classes based on the range of observations and assigning number of
observations lying in each class. The following is another example for
classification by size.
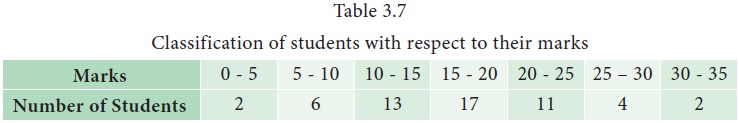
Example 3.7
The
classification of 55 students according to their marks is given in Table 3.7
Rules for Classification of Data
There
are certain rules to be followed for classifying the data which are given
below.
·
The
classes must be exhaustive, i.e., it should be possible to include each of the
data points in one or the other group or class.
·
The
classes must be mutually exclusive, i.e., there should not be any overlapping.
·
It
must be ensured that number of classes should be neither too large or nor too
small. Generally, the number of classes may be fixed between 4 and 15.
·
The
magnitude or width of all the classes should be equal in the entire
classification.
·
The
system of open end classes may be avoided.
Related Topics