Chapter: 11th Statistics : Chapter 3 : Classification and Tabulation of Data
Bivariate Frequency Distributions
Bivariate
Frequency Distributions
It
is known that the frequency distribution of a single variable is called
univariate distribution. When a data set consists of a large mass of
observations, they may be summarized by using a two-way table. A two-way table
is associated with two variables, say X and Y. For each variable, a number of
classes can be defined keeping in view the same considerations as in the
univariate case. When there are m classes for X and n classes for Y, there will
be m × n cells in the two-way table. The classes of one variable may be
arranged horizontally, and the classes of another variable may be arranged
vertically in the two way table. By going through the pairs of values of X and
Y, we can find the frequency for each cell. The whole set of cell frequencies
will then define a bivariate frequency distribution. In other words, a
bivariate frequency distribution is the frequency distribution of two variables.
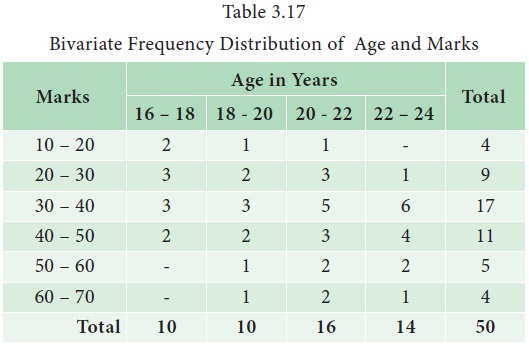
Table
3.17 shows the frequency distribution of two variables, namely, age and marks
obtained by 50 students in an intelligent test. Classes defined for marks are
arranged horizontally (rows) and the classes defined for age are arranged
vertically (columns). Each cell shows the frequency of the corresponding row
and column values. For instance, there are 5 students whose age fall in the
class 20 – 22 years and their marks lie in the group 30 – 40.

Related Topics