Classification and Tabulation of Data | Statistics - Components of a Table | 11th Statistics : Chapter 3 : Classification and Tabulation of Data
Chapter: 11th Statistics : Chapter 3 : Classification and Tabulation of Data
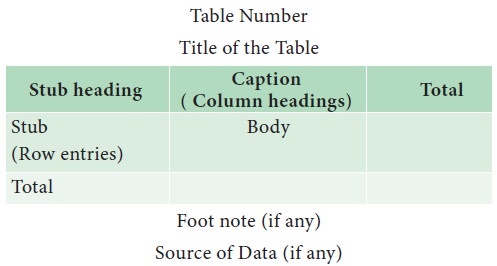
Components of a Table
Components
of a Table
Generally
a table should be comprised of the following components:
i.
Table
number and title
ii.
Stub
(the headings of rows)
iii.
Caption
(the headings of columns)
iv.
Body
of the table
v.
Foot
notes
vi.
Sources
of data.
i. Table Number and Title: Each table should be identified by
a number given at the top. It should
also have an appropriate short and self explanatory title indicating what
exactly the table presents.
ii. Stub: Stubs stand for brief and self
explanatory headings of rows.
iii. Caption: Caption stands for brief and self
explanatory headings of columns. It
may involve headings and sub-headings as well.
iv. Body of the Table: The body of the table should
provide the numerical information in
different cells.
v. Foot Note: The explanatory notes should be
given as foot notes and must be complete
in order to understand them at a later stage.
vi. Source of Data: It is always customary to provide
source of data to enable the user to
refer the original data. The source of data may be provided in a foot note at
the bottom of the table.
A
typical format of a table is given below:
General Precautions for Tabulation
The
following points may be considered while constructing statistical tables:
·
A
table must be as precise as possible and easy to understand.
·
It
must be free from ambiguity so that main characteristics from the data can be
easily brought out.
·
Presenting
a mass of data in a single table should be avoided. Displaying the data in a
single table would increase the chances for occurrence of mistakes and would
make the table unwieldy. Such data may be presented in more than one table such
that each table should be complete and should serve the purpose.
·
Figures
presented in columns for comparison must be placed as near to each other as
possible. Percentages, totals and averages must be kept close to each other. Totals
to be compared may be given in bold type wherever necessary.
·
Each
table should have an appropriate short and self- explanatory title indicating
what exactly the table presents.
·
The
main headings and subheadings must be properly placed.
·
The
source of the data must be indicated in the footnote.
·
The
explanatory notes should always be given as footnotes and must be complete in
order to understand them at a later stage.
·
The
column or row heads should indicate the units of measurements such as monetary
units like Rupees, and other units such as meters, etc. wherever necessary.
·
Column
heading may be numbered for comparison purposes. Items may be arranged either
in the order of their magnitude or in alphabetical, geographical, and
chronological or in any other suitable arrangement for meaningful presentation.
·
Figures
as accurate as possible are to be entered in a table. If the figures are
approximate, the same may be properly indicated.
Related Topics