Chapter: Advanced Computer Architecture : Memory And I/O
RAID : Redundant Arrays of Inexpensive Disks
RAID : Redundant Arrays of
Inexpensive Disks
An
innovation that improves both dependability and performance of storage systems
is disk arrays. One argument for arrays is that potential throughput can be
increased by having many disk drives and, hence, many disk arms, rather than
one large drive with one disk arm. Although a disk array would have more faults
than a smaller number of larger disks when each disk has the same reliability,
dependability can be improved by adding redundant disks to the array to
tolerate faults. That is, if a single disk fails, the lost information can be
reconstructed from redundant information.
The only
danger is in having another disk fail between the time the first disk fails and
the time it is replaced (termed mean time to repair, or MTTR). Since the mean
time to failure (MTTF) of disks is tens of years, and the MTTR is measured in
hours, redundancy can make the measured reliability of 100 disks much higher
than that of a single disk. These systems have become known by the acronym
RAID, stand-ing originally for redundant array of inexpensive disks, although
some have re-named it to redundant array of independent disks
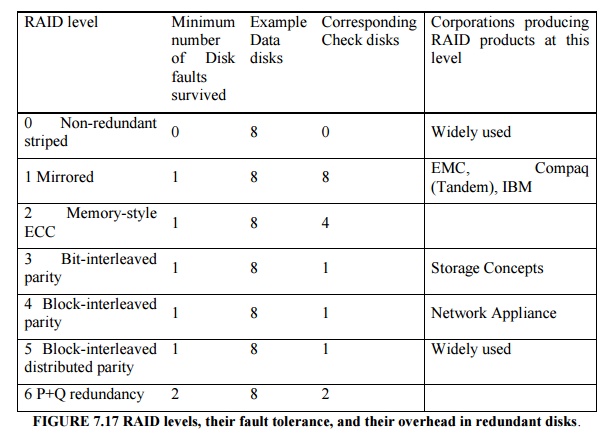
The
several approaches to redundancy have different overhead and performance.
Figure 7.17 shows the standard RAID levels. It shows how eight disks of user
data must be supplemented by redundant or check disks at each RAID level. It
also shows the minimum number of disk failures that a system would survive.
No Redundancy (RAID 0)
This notation is refers to a disk array in which data is striped but there is no redundancy to tolerate disk failure. Striping across a set of disks makes the collection appear to software as a single large disk, which simplifies storage management. It also improves performance for large accesses, since many disks can operate at once. Video editing systems, for example, often stripe their data.
RAID 0
something of a misnomer as there is no redundancy, it is not in the original
RAID taxonomy, and striping predates RAID. However, RAID levels are often left
to the operator to set when creating a storage system, and RAID 0 is often
listed as one of the options. Hence, the term RAID 0 has become widely used.
Mirroring (RAID 1)
This traditional scheme for tolerating disk failure, called mirroring or shadowing, uses twice as many disks as does RAID 0. Whenever data is written to one disk, that data is also written to a redundant disk, so that there are always two copies of the information. If a disk fails, the system just goes to the “mirror” to get the desired information. Mirroring is the most expensive RAID solution, since it requires the most disks.
The RAID
terminology has evolved to call the former RAID 1+0 or RAID 10 (“striped
mirrors”) and the latter RAID 0+1 or RAID 01 (“mirrored stripes”).
Bit-Interleaved Parity (RAID 3)
The cost
of higher availability can be reduced to 1/N, where N is the number of disks in
a protection group. Rather than have a complete copy of the original data for
each disk, we need only add enough redundant information to restore the lost
information on a failure. Reads or writes go to all disks in the group, with
one extra disk to hold the check information in case there is a failure. RAID 3
is popular in applications with large data sets, such as multimedia and some
scientific codes.
Parity is
one such scheme. Readers unfamiliar with parity can think of the redundant disk
as having the sum of all the data in the other disks. When a disk fails, then
you subtract all the data in the good disks from the parity disk; the remaining
information must be the missing information. Parity is simply the sum modulo
two. The assumption behind this technique is that failures are so rare that
taking longer to recover from failure but reducing redundant storage is a good
trade-off.
Block-Interleaved Parity and Distributed
Block-Interleaved Parity (RAID 4 and RAID 5)
In RAID
3, every access went to all disks. Some applications would prefer to do smaller
accesses, allowing independent accesses to occur in parallel. That is the
purpose of the next
RAID levels. Since error-detection information in each sector is checked on reads to see if data is correct, such “small reads” to each disk can occur independently as long as the minimum access is one sector.
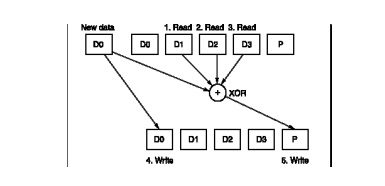
Writes are another matter. It would seem that each small write would demand that all other disks be accessed to read the rest of the information needed to recalculate the new parity, as in Figure 7.18. A “small write” would require reading the old data and old parity, adding the new information, and then writing the new parity to the parity disk and the new data to the data disk.
RAID 4
efficiently supports a mixture of large reads, large writes, small reads, and
small writes. One drawback to the system is that the parity disk must be
updated on every write, so it is the bottleneck for back-to-back writes. To fix
the parity-write bottleneck, the parity information can be spread throughout
all the disks so that there is no single bottleneck for writes. The distributed
parity organization is RAID 5.
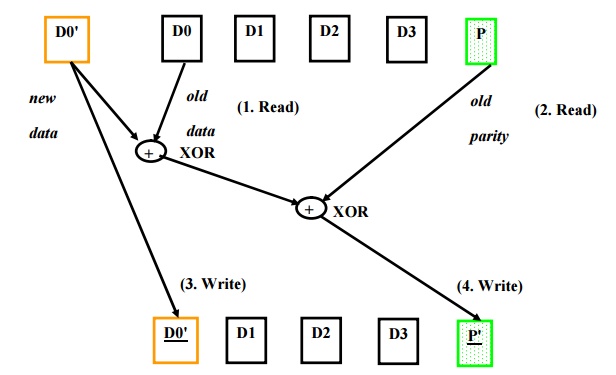
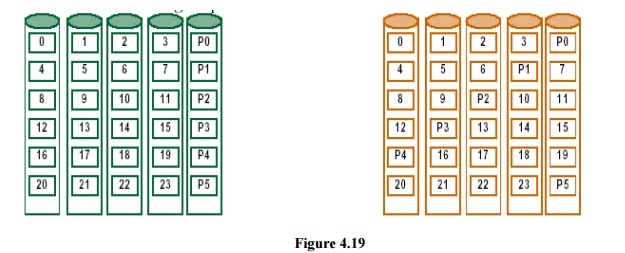
Figure 7.19 shows how data are distributed in RAID 4 vs. RAID 5. As the organization on the right shows, in RAID 5 the parity associated with each row of data blocks is no longer restricted to a single disk. This organization allows multiple writes to occur simultaneously as long as the stripe units are not located in the same disks. For example, a write to block 8 on the right must also access its parity block P2, thereby occupying the first and third disks. A second write to block 5 on the right, implying an update to its parity block P1, accesses the second and fourth disks and thus could occur at the same time as the write to block 8. Those same writes to the organization on the left would result in changes to blocks P1 and P2, both on the fifth disk, which would be a bottleneck.
P+Q redundancy (RAID 6)
Parity
based schemes protect against a single, self-identifying failures. When a
single failure is not sufficient, parity can be generalized to have a second
calculation over the data and another check disk of information. Yet another
parity block is added to allow recovery from a second failure. Thus, the
storage overhead is twice that of RAID 5. The small write shortcut of Figure
7.18 works as well, ex-cept now there are six disk accesses instead of four to
update both P and Q information.
Errors and Failures in Real Systems
Publications
of real error rates are rare for two reasons. First academics rarely have
access to significant hardware resources to measure. Second industrial,
researchers are rarely allowed to publish failure information for fear that it
would be used against their companies in the marketplace. Below are four
exceptions.
Berkeley’s Tertiary Disk
The
Tertiary Disk project at the University of California created an art-image
server for the Fine Arts Museums of San Francisco. This database consists of
high quality images of over 70,000 art works. The database was stored on a
clus-ter, which consisted of 20 PCs containing 368 disks connected by a
switched Ethernet. It occupied in seven 7-foot high racks.
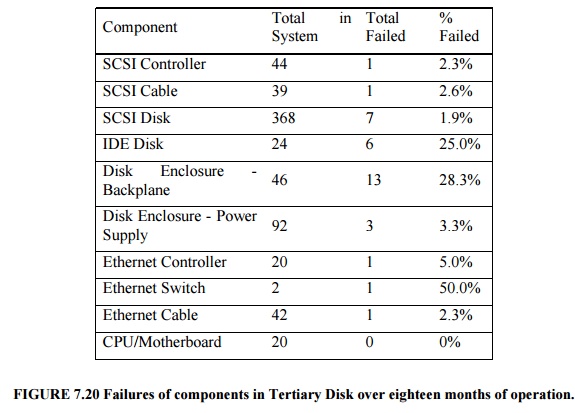
Figure
7.20 shows the failure rates of the various components of Tertiary Disk. In
advance of building the system, the designers assumed that data disks would be
the least reliable part of the system, as they are both mechanical and
plentiful. As Tertiary Disk was a large system with many redundant components,
it had the potential to survive this wide range of failures. Components were
connected and mirrored images were placed no single failure could make any
image unavailable. This strategy, which initially appeared to be overkill,
proved to be vital.
This experience
also demonstrated the difference between transient faults and hard faults.
Transient faults are faults that come and go, at least temporarily fixing
themselves. Hard faults stop the device from working properly, and will
continue to misbehave until repaired.
Tandem
The next
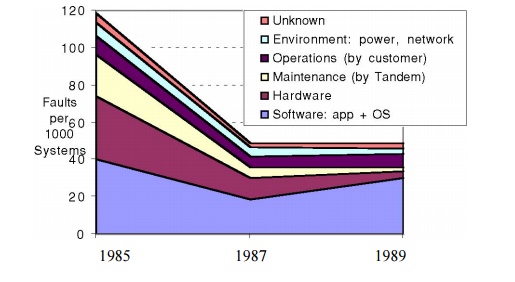
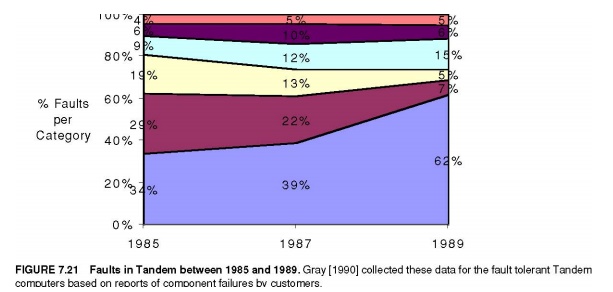
example comes from industry. Gray [1990] collected data on faults for Tandem
Computers, which was one of the pioneering companies in fault tolerant
computing. Figure 7.21 graphs the faults that caused system failures between
1985 and 1989 in absolute faults per system and in percentage of faults
encoun-tered. The data shows a clear improvement in the reliability of hardware
and maintenance.
Disks in 1985 needed yearly service by Tandem, but they were re-placed by disks that needed no scheduled maintenance. Shrinking number of chips and connectors per system plus software’s ability to tolerate hardware faults reduced hardware’s contribution to only 7% of failures by 1989. And when hardware was at fault, software embedded in the hardware device (firmware) was often the culprit. The data indicates that software in 1989 was the major source of reported outages (62%), followed by system operations (15%).
The
problems with any such statistics are that these data only refer to what is
reported; for example, environmental failures due to power outages were not
reported to Tandem because they were seen as a local problem.
VAX
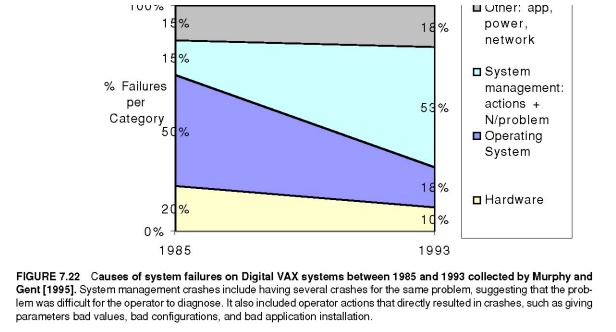
The next
example is also from industry. Murphy and Gent [1995] measured faults in VAX
systems. They classified faults as hardware, operating system, system
management, or application/networking. Figure 7.22 shows their data for 1985
and 1993. They tried to improve the accuracy of data on operator faults by
having the system automatically prompt the operator on each boot for the reason
for that reboot. They also classified consecutive crashes to the same fault as
operator fault. Note that the hardware/operating system went from causing 70%
of the failures in 1985 to 28% in 1993. Murphy and Gent expected system
management to be the primary dependability challenge in the future.
FCC
The final set of data comes from the government. The Federal Communications Commission (FCC) requires that all telephone companies submit explanations when they experience an outage that affects at least 30,000 people or lasts thirty minutes. These detailed disruption reports do not suffer from the self-reporting problem of earlier figures, as investigators determine the cause of the outage rather than operators of the equipment. Kuhn [1997] studied the causes of outages between 1992 and 1994 and Enriquez [2001] did a follow-up study for the first half of 2001. In addition to reporting number of outages, the FCC data includes the number of customers affected and how long they were affected. Hence, we can look at the size and scope of failures, rather than assuming that all are equally important. Figure 7.23 plots the absolute and relative number of customer-outage minutes for those years, broken into four categories:
Ø Failures
due to exceeding the network’s capacity (overload).
Ø Failures
due to people (human).
Ø Outages
caused by faults in the telephone network software (software).
Ø Switch
failure, cable failure, and power failure (hardware).
These
four examples and others suggest that the primary cause of failures in large
systems today is faults by human operators. Hardware faults have declined due
to a decreasing number of chips in systems, reduced power, and fewer
connectors. Hardware dependability has improved through fault tolerance
techniques such as RAID. At least some operating systems are considering
reliability implications before new adding features, so in 2001 the failures
largely occur elsewhere.
Related Topics