Chapter: Advanced Computer Architecture : Memory And I/O
Benchmarks of storage performance and availability
Benchmarks of storage performance
and availability
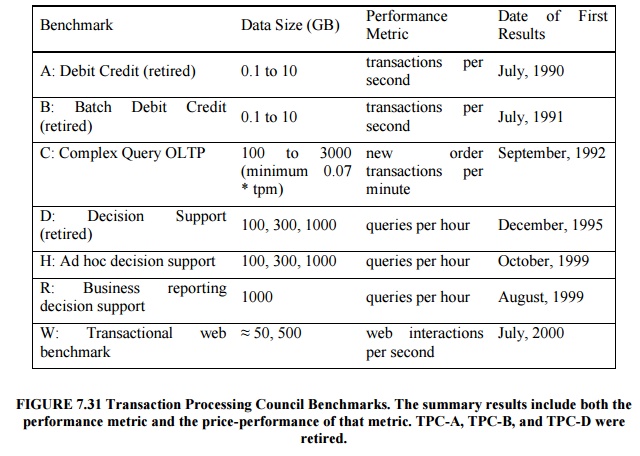
Transaction Processing Benchmarks
Transaction
processing (TP, or OLTP for on-line transaction processing) is chiefly
concerned with I/O rate: the number of disk accesses per second, as opposed to
data rate, measured as bytes of data per second. TP generally involves changes
to a large body of shared
information
from many terminals, with the TP system guaranteeing proper behavior on a
failure.
Suppose,
for example, a bank’s computer fails when a customer tries to withdraw money.
The TP system would guarantee that the account is debited if the customer
received the money and that the account is unchanged if the money was not
received. Airline reservations systems as well as banks are traditional
customers for TP.
This
report led to the Transaction Processing Council, which in turn has led to
seven benchmarks since its founding.
The TPC
benchmarks were either the first, and in some cases still the only ones, that
have these unusual characteristics:
Price is
included with the benchmark results. The cost of hardware, software, and
five-year maintenance agreements is included in a submission, which en-ables
evaluations based on price-performance as well as high performance.
The data
set generally must scale in size as the throughput increases. The benchmarks
are trying to model real systems, in which the demand on the sys-tem and the
size of the data stored in it increase together. It makes no sense, for
example, to have thousands of people per minute access hundreds of bank
ac-counts.
The
benchmark results are audited. Before results can be submitted, they must be
approved by a certified TPC auditor, who enforces the TPC rules that try to
make sure that only
fair
results are submitted. Results can be challenged and disputes resolved by going
before the TPC council.
Throughput
is the performance metric but response times are limited. For ex-ample, with
TPC-C, 90% of the New-Order transaction response times must be less than 5
seconds.
An
independent organization maintains the benchmarks. Dues collected by TPC pay
for an administrative structure including a Chief Operating Office. This
organization settles disputes,
conducts
mail ballots on approval of changes to benchmarks, hold board meetings, and so
on.
SPEC System-Level File Server (SFS) and Web
Benchmarks:
The SPEC
benchmarking effort is best known for its characterization of processor
performance, but has created benchmarks for other fields as well. In 1990 seven
companies agreed on a synthetic benchmark, called SFS, to evaluate systems
running the Sun Microsystems network file service NFS. This benchmark was
upgraded to SFS 2.0 (also called SPEC SFS97) to include support for NSF version
3, using TCP in addition to UDP as the transport protocol, and making the mix
of operations more realistic.
Figure
7.32 shows average response time versus throughput for four systems.
Unfortunately, unlike the TPC benchmarks, SFS does not normalize for different
price configurations. The fastest system in Figure 7.32 has 7 times the number
of CPUs and disks as the slowest system, but SPEC leaves it to you to calculate
price versus performance. As performance scaled to new heights, SPEC discovered
bugs in the benchmark that impact the amount of work done during the
measurement periods. Hence, it was retired in June 2001.
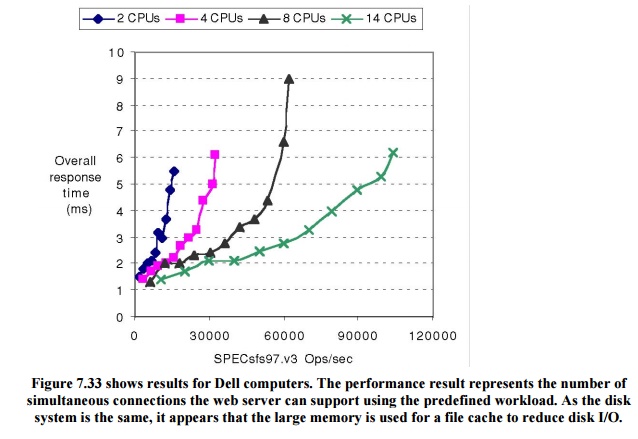
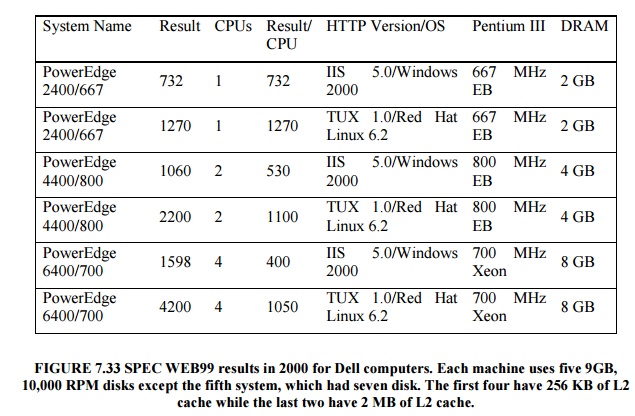
SPEC WEB
is a benchmark for evaluating the performance of World Wide Web servers.
The SPEC
WEB99 workload simulates accesses to a web service provider, where the server
supports home pages for several organizations. Each home page is a collection
of files ranging in size from small icons to large docu-ments and images, with
some files being more popular than others. The workload defines four sizes of
files and their frequency of activity:
less than
1 KB, representing an small icon: 35% of activity
1 to 10
KB: 50% of activity
10 to 100
KB: 14% of activity
100 KB to
1 MB: representing a large document and image,1% of activity
Related Topics