Chapter: Psychology: Research Methods
Psychology: Working With Data
WORKING WITH DATA
After we’ve defined a question,
chosen a sample, and collected the data—what’s next? To address this question,
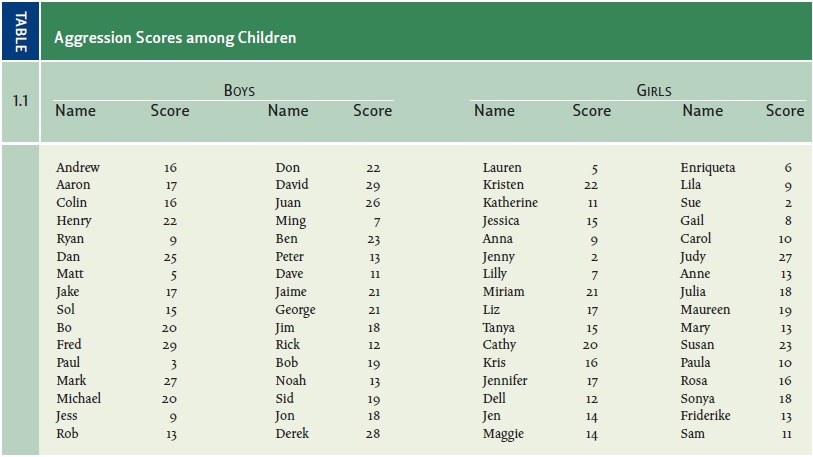
let’s press on with our earlier example. Imagine that some researchers have
measured the aggressiveness of a group of boys playing together and a group of
girls playing together, so they now have an “aggression score” for each person.
This leaves the researchers with two lists of numbers, as shown in Table 1.1.
(The data in the table are fic-tional, but we’ll describe the real outcome of
this sort of comparison before we’re done.) In most studies, the researchers’
next step would involve some sort of statistical analysis of the data. Broadly
speaking, this analysis will have two parts: First, the researchers will rely
on descriptive statistics to summarize
the data. Second, the researchers will use inferential
statistics to ask how confident they can be in drawing conclusions based on
their sample. This is, of course, usually the step that tells the researchers
whether the data support their hypothesis or not.
Descriptive Statistics
In Table 1.1, it’s difficult to
see any pattern at all. Some of the boys’ numbers are high, and some are lower;
the same is true for the girls. With the data in this format, it’s hard to see
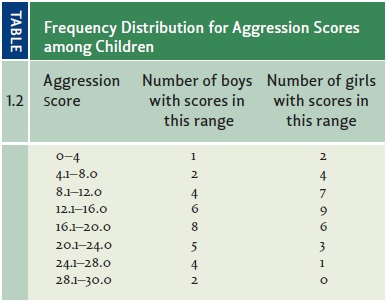
anything beyond these general points. The pattern becomes obvious, however, if
we summarize these data in terms of a frequency
distribution (Table 1.2)—a table that lists how many scores fall into each
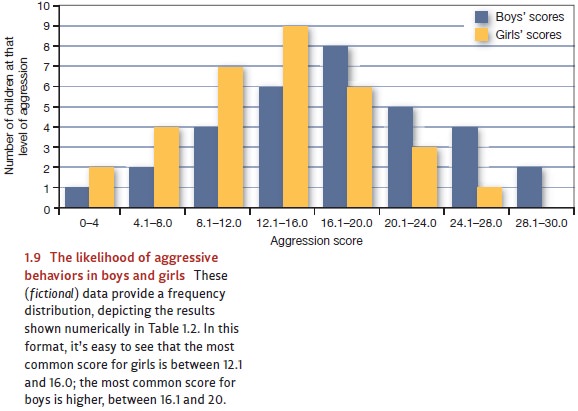
of the designated categories. The pattern is clearer still if we graph the
frequency distributions (Figure 1.9). Now we
most common scores (in these fictional data) are between 16.1 and 20 for
the boys andbetween 12.1 and 16.0 for the girls. As we move further and
furtherfrom these central
categories (looking either
at higher scores
orlower), the number of people at each level of aggression drops.
Related Topics