Chapter: Software Testing : Test Case Design
Other Black Box Test Design Approaches
Other Black Box Test Design
Approaches
There are
alternative methods to equivalence class partitioning/boundary value analysis
that a tester can use to design test cases based on the functional
specification for the software to be tested. Among these are causeand effect
graphing, state transition testing, and error guessing. Equivalence class
partitioning combined with boundary value analysis is a practical approach to
designing test cases for software written in both procedural and
object-oriented languages since specifications are usually available for both
member functions associated with an object and traditional procedures and
functions to be written in procedural languages. However, it must be emphasized
that use of equivalence class partitioning should be complimented by use of
white box and, in many cases, other black box test design approaches. This is
an important point for the tester to realize. By combining strategies and
methods the tester can have more confidence that the test cases will reveal a
high number of defects for the effort expended. White box approaches to test
design will be described in the next chapter. We will use the remainder of this
section to give a description of other black box techniques.
Cause - and - Effect Graphing
A major
weakness with equivalence class partitioning is that it does not allow testers
to combine conditions. Combinations can be covered in some cases by test cases
generated from the classes. Cause-and-effect graphing is a technique that can
be used to combine conditions and derive an effective set of test cases that
may disclose inconsistencies in a specification. However, the specification
must be transformed into a graph that resembles a digital logic circuit. The
tester is not required to have a background in electronics, but he should have
knowledge of Boolean logic. The graph itself must be expressed in a graphical
language [1]. Developing the graph, especially for a complex module with many
combinations of inputs, is difficult and time consuming. The graph must be
converted to a decision table that the tester uses to develop test cases. Tools
are available for the latter process and allow the derivation of test cases to
be more practical using this approach. The steps in developing test cases with
a cause-and-effect graph are as follows
The
tester must decompose the specification of a complex software component into
lower level units.
For each
specification unit, the tester needs to identify causes and their effects. A
cause is a distinct input condition or an equivalence class of input
conditions. An effect is an output condition or a system transformation.
Putting together a table of causes and effects helps the tester to record the
necessary details. The logical relationships between the causes and effects
should be determined. It is useful to express these in the form of a set of
rules.
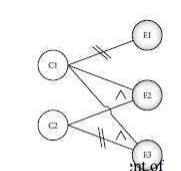
From the
cause-and-effect information, a Boolean cause-and-effect graph is created.
Nodes in the graph are causes and effects. Causes are placed on the left side
of the graph and effects on the right. Logical relationships are expressed
using standard logical operators such as AND, OR, and NOT, and are associated
with arcs. An example of the notation is shown in Figure 4.4. Myers shows
additional examples of graph notations.
The graph
may be annotated with constraints that describe combinations of causes and/or
effects that are not possible due to environmental or syntactic constraints.
The graph
is then converted to a decision table.
The
columns in the decision table are transformed into test cases. The following
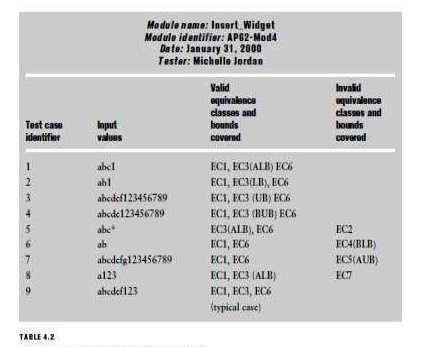
example illustrates the application of this technique. Suppose we have a
specification for a module that allows a user to perform a search for a
character in an existing string. The specification states that the user must
input the length of the string and the character to search for. If the string
length is out-of-range an error message will appear. If the character appears
in the string, its position will be reported. If the character is not in the string
the message not found will be output. The input conditions, or causes are as
follows:
C1:
Positive integer from 1 to 80
C2:
Character to search for is in string
The
output conditions, or effects are: E1:
Integer
out of range
E2:
Position of character in string
E3:
Character not found
The rules
or relationships can be described as follows:
If C1 and
C2, then E2.
If C1 and
not C2, then E3.
If not
C1, then E1.

Based on
the causes, effects, and their relationships, a cause-and-effect graph to
represent this information is shown in Figure 4.5. The next step is to develop
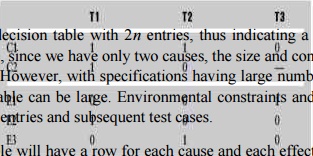
a decision table. The decision table reflects the rules and the graph and shows
the effects for all possible combinations of causes. Columns list each combination
of causes, and each column represents a test case. Given n causes this could lead to a decision table with 2 n entries, thus indicating a possible
need for many test cases. In this example, since we have only two causes, the
size and complexity of the decision table is not a big problem. However, with
specifications having large numbers of causes and effects the size of the
decision table can be large. Environmental constraints and unlikely
combinations may reduce the number of entries and subsequent test cases.
A
decision table will have a row for each cause and each effect. The entries are
a reflection of the rules and the entities in the cause and effect graph.
Entries in the table can be represented by a for a cause or effect that is
present, a ―0‖
represents the absence of a cause or effect,and a indicates a don‘t care ‖ value. A decision table for our
simple example is shown in Table where C1, C2, C3 represent the causes, E1, E2,
E3 the effects, and columns T1, T2, T3 the test cases. The tester can use the
decision table to consider combinations of inputs to generate the actual tests.
In this example, three test cases are called for. If the existing string is
―abcde, then possible tests are the following:
One
advantage of this method is that development of the rules and the graph from
the specification allows a thorough inspection of the specification. Any
omissions, inaccuracies, or inconsistencies are likely to be detected. Other
advantages come from exercising combinations of test data that may not be
considered using other black box testing techniques. The major problem is
developing a graph and decision table when there are many causes and effects to
consider. A possible solution to this is to decompose a complex specification
into lower-level, simpler components and develop cause-and-effect graphs and
decision tables for these. Myers has a detailed description of this technique
with examples [1]. Beizer [5] and Roper [9] also have discussions of this
technique. Again, the possible complexity of the graphs and tables make it
apparent that tool support is necessary for these time-consuming tasks.
Although an effective set of test cases can be derived, some testers believe
that equivalence class partitioning—if performed in a careful and systematic
way—will generate a good set of test cases, and may make more effective useof a
tester‘s time.
State transition testing
State
transition testing is useful for both procedural and object-oriented
development. It is based on the concepts of states and finite-state machines,
and allows the tester to view the developing software in term of its states,
transitions between states, and the inputs and events that trigger state
changes. This view gives the tester an additional opportunity to develop test
cases to detect defects that may not be revealed using the input/output
condition as well as cause-and-effect views presented by equivalence class
partitioning and cause-and-effect graphing. Some useful definitions related to
state concepts are as follows:
A state is an internal configuration of a system or
component. It is defined in terms of the values assumed at a particular time
for the variables that characterize the system or component.
A finite-state machine is an abstract machine that
can be represented by a state graph having a finite number of states and a
finite number of transitions between states.
During
the specification phase a state transition graph (STG) may be generated for the
system as a whole and/or specific modules. In object oriented development the
graph may be called a state chart. STG/state charts are useful models of
software (object) behavior. STG/state charts are commonly depicted by a set of
nodes (circles, ovals, rounded rectangles) which represent states. These
usually will have a name or number to identify the state. A set of arrows
between nodes indicate what inputs or events will cause a transition or change
between the two linked states. Outputs/actions occurring with a state
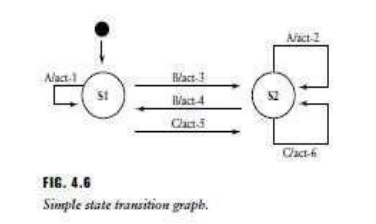
transition are also depicted on a link or arrow. A simple state transition
diagram is shown in Figure 4.6. S1 and S2 are the two states of interest. The
black dot represents a pointer to the initial state from outside the machine.
Many STGs also have ―error‖ states
and ―done‖ states,
the latter to indicate a final state for the system. The arrows display
inputs/actions that cause the state transformations in the arrow directions.
For example, the transition from S1 to S2 occurs with input, or event B. Action
3 occurs as part of this state transition. This is represented by the symbol
―B/act3.‖ It is often useful to attach to
the STG the system or component variables that are affected by state
transitions. This is valuable information for the tester as we will see in
subsequent paragraphs. For large systems and system components, state
transition graphs can become very complex. Developers can nest them to
represent different levels of abstraction. This approach allows the STG
developer to group a set of related states together to form an encapsulated
state that can be represented as a single entity on the original STG. The STG
developer must ensure that this new state has the proper connections to the
unchanged states from the original STG. Another way to simplify the STG is to
use a state table representation which may be more concise. A state table for
the STG in Figure 4.6 is shown in Table 4.4. The state table lists the inputs
or events that cause state transitions.
For each
state and each input the next state and action taken are listed. Therefore, the
tester can consider each entity as a representation of a state transition. As
testers we are interested in using an existing STG as an aid to designing
effective tests. Therefore this text will not present a discussion
of
development and evaluation criteria for STGs. We will assume that the STGs have
been prepared by developers or analysts as a part of the requirements
specification. The STGs should be subject to a formal inspection when the
requirement/specification is reviewed. This step is required for organization
assessed at TMM level 3 and higher. It is essential that testers be present at
the reviews. From the tester‘s view point the review should ensure that (i) the
proper number of states are represented, (ii) each state transition
(input/output/action) is correct, (iii) equivalent states are identified, and
(iv) unreachable and dead states are identified. Unreachable states are those
that no input sequence will reach, and may indicate missing transitions. Dead
states are those that once entered cannot be exited. In rare cases a dead state
is legitimate, for example, in software that controls a destructible device.
After the STG has been reviewed formally the tester should plan appropriate
test cases. An STG has similarities to a control flow graph in that it has
paths, or successions of transitions, caused by a sequence of inputs. Coverage
of all paths does not guarantee complete testing and may not be practical. A
simple approach might be to develop tests that insure that all states are
entered. A more practical and systematic approach suggested by Marik consists
of testing every possible state transition [10]. For the simple state machine
in Figure 4.6 and Table 4.4 the transitions to be tested are:
Input A in
S1
Input A
in S2
Input B
in S1
Input B
in S2
Input C
in S1
Input C
in S2
The
transition sequence requires the tester to describe the exact inputs for each
test as the next step. For example the inputs in the above transitions might be
a command, a menu item, a signal from a device or a button that is pushed. In
each case an exact value is required, for example, the command might be ead,
the signal might be ot or the button might be ff. The exact sequence of inputs
must also be described, as well as the expected sequence of state changes, and
actions. Providing these details makes state-based tests easier to execute,
interpret, and maintain. In addition, it is best to design each test
specification so that the test begins in the start state, covers intermediate
states, and returns to the start state. Finally, while the tests are being
executed it is very useful for the tester to have software probes that report
the current state (defining a state variable may be necessary) and the incoming
event. Making state- related variables visible during each transition is also
useful. All of these probes allow the tester to monitor the tests and detect
incorrect transitions and any discrepancies in intermediate results.
For some
STGs it may be possible that a single test case specification sequence could
use (exercise) all of the transitions. There is a difference of opinion as to
whether this is a good approach [5,10]. In most cases it is advisable to
develop a test case specification that exercises many transitions, especially
those that look complex, may not have been tried before, or that look ambiguous
or unreachable. In this way more defects in the software may be revealed. For
further exploration of state-based testing the following references are
suggested.
Error Guessing
Designing
test cases using the error guessing approach is based on the
tester‘s/developer‘s past experience with code similar to the code-under- test,
and their intuition as to where defects may lurk in the code. Code similarities
may extend to the structure of the code, its domain, the design approach used,
its complexity, and other factors. The tester/developer is sometimes able to
make an educated uess as to which types of defects may be present and design
test cases to reveal them. Some examples of obvious types of defects to test
for are cases where there is a possible division by zero, where there are a
number of pointers that are manipulated, or conditions around array boundaries.
Error guessing is an ad hoc approach to test design in most cases. However, if
defect data for similar code or past releases of the code has been carefully
recorded, the defect types classified, and failure symptoms due to the defects
carefully noted, this approach can have some structure and value. Such data would
be available to testers in a TMM level 4 organization.
Black Box Testing and Commercial Off-the-Shelf
(COTS) Components
As
software development evolves into an engineering discipline, the reuse of
software components will play an increasingly important role. Reuse of
components means that developers need not reinvent the wheel; instead they can
reuse an existing software component with the required functionality. The
reusable component may come from a code reuse library within their organization
or, as is most likely, from an outside vendor who specializes in the
development of specific types of software components. Components produced by
vendor organizations are known as commercial off-the-shelf, or COTS,
components. The following data illustrate the growing usage of COTS components.
In 1997, approximately 25% of the component portfolio of a typical corporation
consisted of COTS components. Estimates for 1998 were about 28% and during the
next several years the number may rise to 40%.
Using
COTS components can save time and money. However, the COTS component must be
evaluated before becoming a part of a developing system. This means that the
functionality, correctness, and reliability of the component must be
established. In addition, its suitability for the application must be
determined, and any unwanted functionality must be identified and addressed by
the developers. Testing is one process that is not eliminated when COTS
components are used for development!When a COTS component is purchased from a vendor
it is basically a black box. It can range in size from a few lines of code, for
example, a device driver, to thousands of lines of code, as in a
telecommunication subsystem. It most cases, no source code is available, and if
it is, it is very expensive to purchase. The buyer usually receives an
executable version of the component, a description of its functionality, and
perhaps a statement of how it was tested. In some cases if the component has
been widely adapted, a statement of reliability will also be included. With
this limited information, the developers and testers must make a decision on
whether or not to use the component. Since the view is mainly as a black box,
some of the techniques discussed in this chapter are applicable for testing the
COTS components.
If the
COTS component is small in size, and a specification of its inputs/outputs and
functionality is available, then equivalence class partitioning and boundary
value analysis may be useful for detecting defects and establishing component
behavior. The tester should also use this approach for identifying any unwanted
or unexpected functionality or side effects that could have a detrimental
effect on the application. Assertions, which are logic statements that describe
correct program behavior, are also useful for assessing COTS behavior. They can
be associated with program components, and monitored for violations using
assertion support tools. Large-sized COTS components may be better served by
using random or statistical testing guided by usage profiles.
Usage profiles are characterizations of the
population of intended uses of the software in its intended environment .
These are
not strictly black box in nature. As in the testing of newly developing
software, the testing of COTS components requires the development of test
cases, test oracles, and auxiliary code called a test harness (described in
Chapter 6). In the case of COTS components, additional code, called glue
software, must be developed to bind the COTS component to other modules for
smooth system functioning. This glue software must also be tested. All of these
activities add to the costs of reuse and must be considered when project plans
are developed. Researchers are continually working on issues related to testing
and certification of COTS components.
Certification refers to third-party assurance that
a product (in our case a software product), process, or service meets a
specific set of requirements.
Related Topics