Chapter: Software Testing : Test Case Design
Coverage and Control Flow Graphs
Coverage and Control Flow Graphs
The
application of coverage analysis is typically associated with the use of
control and data flow models to represent program structural elements and data.
The logic elements most commonly considered for coverage are based on the flow
of control in a unit of code. For example,
(i) program statements;
(ii) decisions/branches (these influence the program flow of control);
(iii) conditions (expressions that evaluate to true/false, and do not contain any other true/false-valued expressions);
(iv)combinations
of decisions and conditions;
(v)
paths
(node sequences in flow graphs).
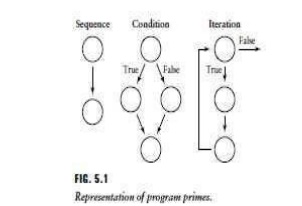
These
logical elements are rooted in the concept of a program prime. A program prime
is an atomic programming unit. All structured programs can be built from three
basic primes-sequential (e.g., assignment statements), decision (e.g.,
if/then/else statements), and iterative (e.g., while, for loops). Graphical
representations for these three primes are shown in Figure 5.1.
Using the
concept of a prime and the ability to use combinations of primes to develop
structured code, a (control) flow diagram for the soft- ware unit under test
can be developed. The flow graph can be used by the tester to evaluate the code
with respect to its testability, as well as to develop white box test cases.
This will be shown in subsequent sections of this chapter. A flow graph
representation for the code example in Figure 5.2 is found in Figure 5.3. Note
that in the flow graph the nodes represent sequential statements, as well as
decision and looping predicates. For simplicity, sequential statements are
often omitted or combined as a block that indicates that if the first statement
in the block is executed, so are all the following statements in the block.
Edges in the graph represent transfer of control. The direction of the transfer
depends on the outcome of the condition in the predicate (true or false).
There are
commercial tools that will generate control flow graphs from code and in some
cases from pseudo code. The tester can use tool support for developing control
flow graphs especially for complex pieces of code. A control flow
representation for the software under test facilitates the design of white
box-based test cases as it clearly shows the logic elements needed to design
the test cases using the coverage criterion of choice.Zhu has formally
described a set of program-based coverage criteria in the context of test
adequacy criteria and control/data flow models.
This
chapter will presents control-flow, or logic-based, coverage concepts in a less
formal but practical manner to aid the tester in developing test data sets,
setting quantifiable testing goals, measuring results, and evaluating the
adequacy of the test outcome. Examples based on the logic elements listed
previously will be presented. Subsequent sections will describe data flow and
fault-based coverage criteria.
Related Topics