Chapter: Physics : Properties of Mater and Thermal Physics
Lee's Disc Method for Bad Conductors
LEE’S
DISC METHOD FOR BAD CONDUCTORS
The thermal conductivity o bad
conductors like ebonite or card board is determined by this methods.
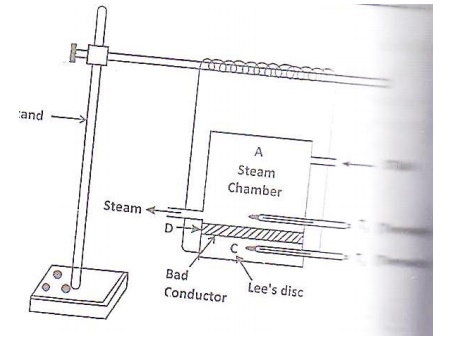
Description:
The apparatus consists o circular metal
disc or slab C(Lee’s Disc) by strings rom as stand. The given bad conductor (such
as glass, ebonite) is taken in the orm of the disc(D).
This disc has the same diameter as
that of the slab and is placed over it.
A cylindrical hollow steam chamber
A having the same diameter as that of the slab is placed over the bad
conductor. There are holes in the steam chamber and the slab through which
thermometers T1 and T2 are inserted to record the respective
temperatures.
Working
:
Steam is passed through the steam
chamber until the temperatures o the chamber and the slab are ready. When the
thermometer show steady temperatures, there reading θ1 and θ2
are noted. The radius(r) o the disc D and its thickness (d) are also noted.
Observation
and Calculation
Thickness of the bad conductor = d
meter
Radius of the bad conductor = r
meter
Mass of the Slab (c) = M kg
Steady temperature in the steam
chamber = θ1
Steady temperature in the bad
conductor = θ2
Thermal conductivity o the bad
conductor = K
Rate o cooling at θ1 = R
Speciic heat capacity of the slab =
S
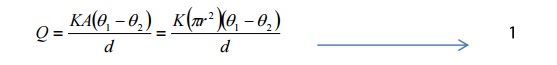
Area o cross section A = πr2
Amount of heat conducted through
the specimen per second
At this stage, all the heat
conducted through the bad conductor is completely radiated by the bottom flat surface
and the curved surface of the Slab C.
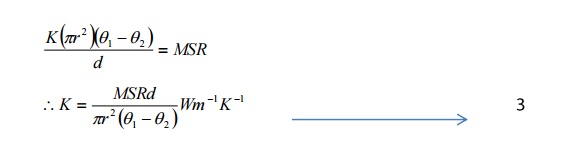
Amount of heat lost per second by
the Slab C
Q= Mass x Specific Heat Capacity x
Rate of cooling
Q =MSR

Heat conducted through bad
conductor per second = heat lost [per seond by the slab
Hence the equation (1) and (2) are
equal
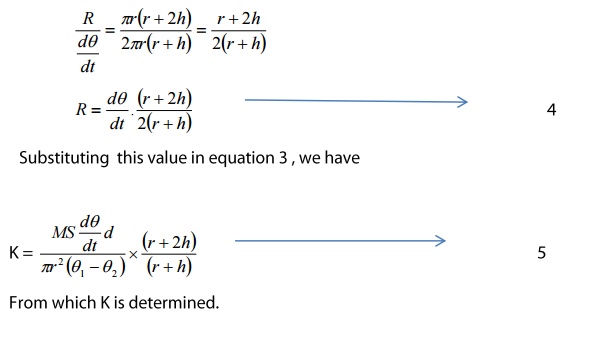
Determination
of Rate of Cooling
The bad conductor is removed and
the steam chmber is placed directly on the slab. The slab is heated to a
temperature of about 5oC higher than θ2.
The steam chamber is removed and
the slab alone is allowed to cool.
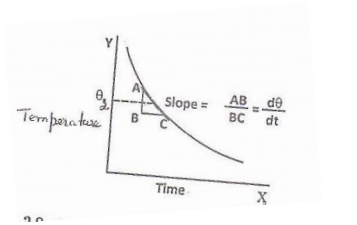
As the slab cools, the temperatures
of the slab are noted at regular intervals of hal a minute until the
temperature o the slab falls to about 5oC below θ2. The time
temperature graph is drawn as shown in the igure and the rate of cooling dθ/dt
at the steady temperature θ2 is determined.
During the first part of the
experiment, the top surface of the slab is covered by the bad conductor.
Radiation is taking place only from the bottom surface area and curved surface area.

In the second part o the experiment,
heat is radiated from the top surface aream the bottom surface area and the
curved sides i.e. over an area
Related Topics