Chapter: High Voltage Engineering : Generation of High Voltages and High Currents
Impulse Voltages
Impulse Voltages
As
explained in detail in the above Chapter , disturbances of electric power
transmission and distribution systems are frequently caused by two kinds of
transient voltages whose amplitudes may greatly exceed the peak values of the
normal a.c. operating voltage. The first kind are lightning overvoltage,
originated by lightning stroke shitting the phase wires of overhead lines or
the bus bars of outdoor substations. The amplitudes are very high, usually in
the order of 1000 kV or more, as every stroke may inject lightning currents up
to about 100 kA and even more into the transmission line;_27_ each stroke is
then followed by travelling waves, whose amplitude is often limited by the
maximum insulation strength of the overhead line. The rate of voltage rise of
such a travelling wave is at its origin directly proportional to the steepness
of the lightning current, which may exceed 100 kA/μsec, and the voltage levels
may simply be calculated by the current multiplied by the effective surge
impedance of the line. Too high voltage levels are immediately chopped by the
breakdown of the insulation and therefore travelling waves with steep wave
fronts and even steeper wave tails may stress the insulation of power
transformers or other h.v. equipment severely. Lightning protection systems,
surge arresters and the different kinds of losses will damp and distort the
travelling waves, and therefore lightning overvoltage’s with very different
wave shapes are present within the transmission system.
The
second kind is caused by switching phenomena. Their amplitudes are always
related to the operating voltage and the shape is influenced by the impedances
of the system as well as by the switching conditions. The rate of voltage rise
is usually slower, but it is well known that the wave shape can also be very dangerous
to different insulation systems, especially to atmospheric air insulation in
transmission systems with voltage levels higher than 245 kV. Both types of over
voltages are also effective in the l V. distribution systems, where they are
either produced by the usual, sometimes current-limiting, switches or where
they have been transmitted from the h.v. distribution systems.
Here they
may often cause a breakdown of electronic equipment, as they can reach
amplitudes of several kilovolts, and it should be mentioned that the testing of
certain l V. apparatus with transient voltages or currents is a need today.
Such tests also involve ‘electromagnetic compatibility (EMC) tests’, which will
not be discussed here. Although the actual shape of both kinds of overvoltage
varies strongly, it became necessary to simulate these transient voltages by
relatively simple means for testing purposes. The various national and
international standards define the impulse voltages as a unidirectional voltage
which rises more or less rapidly to a peak value and then decays relatively
slowly to zero.
In the
relevant IEC Standard 60, widely accepted today through national committees, a
distinction is made between lightning and switching impulses, i.e. according to
the origin of the transients. Impulse voltages with front duration’s varying
from less than one up to a few tens of microseconds are, in general, considered
as lightning impulses. Figure 3.19(a) shows the shape for such a ‘full’
lightning impulse voltage as well as sketches for the same voltage chopped at
the tail (Fig. 3.19(b)) or on the front (Fig. 3.19(c)), i.e. interrupted.
Tc: time
to chopping. O1 : virtual origin disruptive discharge. Although the definitions
are clearly indicated, it should be emphasized that the ‘virtual origin’ O1 is
defined where the line AB cuts the time axis. The ‘front time’ T1, again a
virtual parameter, is defined as 1.67times the interval T between the instants
when the impulse is 30 per cent and90 per cent of the peak value for full or chopped
lightning impulses. For front-chopped impulses the ‘time to chopping’ Tc is
about equal to T1. The reason for defining the point A at 30 per cent voltage
level can be found in most records of measured impulse voltages.
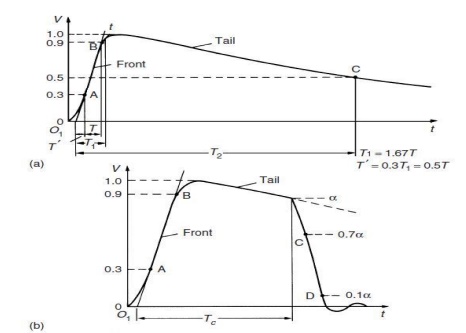
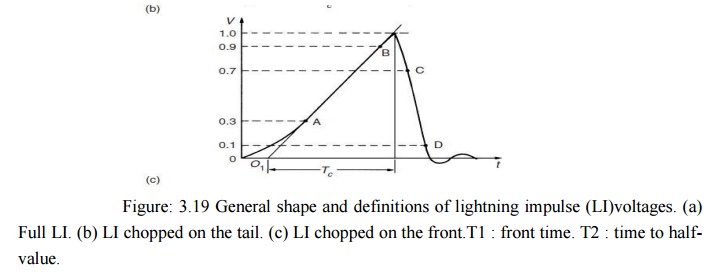
Figure:
3.19 General shape and definitions of lightning impulse (LI)voltages. (a) Full
LI. (b) LI chopped on the tail. (c) LI chopped on the front.T1 : front time. T2
: time to half-value.
It is
quite difficult to obtain a smooth slope within the first voltage rise, as the
measuring systems as well as stray capacitances and inductances may cause
oscillations. For most applications, the (virtual) front time T1 is 1.2 μs, and
the (virtual) time to half-value T2 is 50 μs.
In
general the specifications permit a tolerance of up to 30 per cent for T1 and
20 per cent for T2. Such impulse voltages are referred to as a T1/T2 impulse,
and therefore the 1.2/50 impulse is the accepted standard lightning impulse
voltage today. Lightning impulses are therefore of very short duration, mainly
if they are chopped on front. Due to inherent measurement errors and uncertain
tie-in the evaluation the ‘time parameters’ T1, T2 and Tc or especially the
time difference between the points C and D (Figs 3.19 (b) and (c)) can hardly
be quantified with high accuracy.
Figure
3.20 illustrates the slope of a switching impulse. Whereas the time to
half-value T2 is defined similarly as before, the time to peak Tp is the time
interval between the actual origin and the instant when the voltage has reached
its maximum value. This definition could be criticized, as it is difficult to
establish the actual crest value with high accuracy. An additional parameter is
therefore the time Td, the time at 90 per cent of crest value. The different
definitions in comparison to lightning impulses can be understood if the time
scale is emphasized: the standard switching impulse has time parameters (including
tolerances) and is therefore described as a 250/2500 impulse.
For
fundamental investigations concerning the insulation strength of long air gaps
or other apparatus, the time to peak has to be varied between about 100 and
1000 μs, as the breakdown strength of the insulation systems may be sensitive
upon the voltage wave shape.
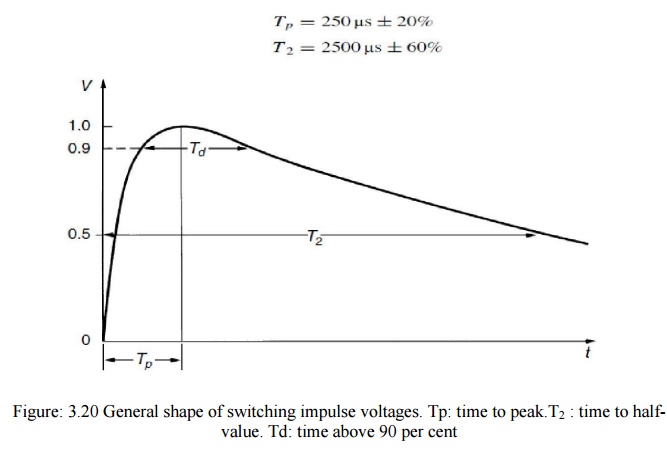
Figure:
3.20 General shape of switching impulse voltages. Tp: time to peak.T2
: time to half-value. Td: time above 90 per cent
Related Topics