Chapter: Basic Radiology : Liver, Biliary Tract, and Pancreas
Exercise: Focal Liver Diseases
EXERCISE 11-2.
FOCAL LIVER DISEASES
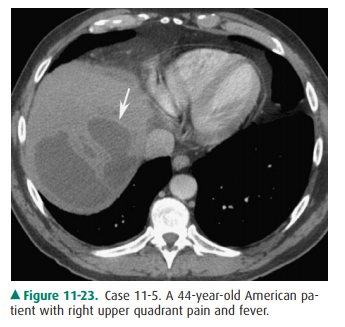
11-5. What is the most likely diagnosis in Case 11-5 (Figure
11-23)?
A.
Pyogenic liver abscess
B.
Echinococcal disease
C.
Candidiasis
D.
Amoebic abscess
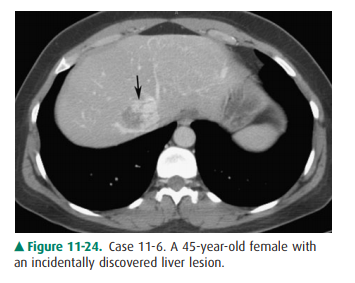
11-6. What is the most likely diagnosis in Case 11-6 (Figure
11-24)?
A.
Hemangioma
B.
Metastatic disease
C.
Angiosarcoma
D.
Focal nodular hyperplasia
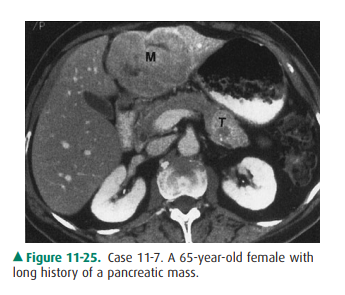
11-7. What is the most likely diagnosis in Case 11-7 (Figure
11-25)?
A.
Hemangioma
B.
Hepatocellular carcinoma
C.
Metastatic disease
D.
Liver cell adenoma
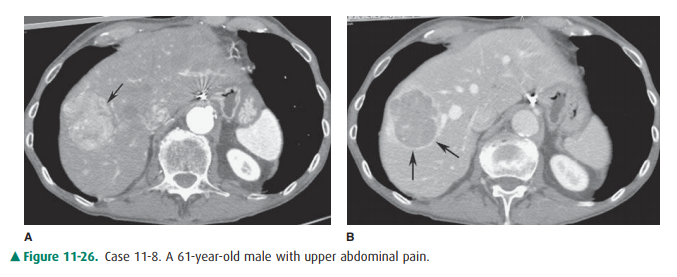
11-8. What is the most likely diagnosis in Case 11-8 (Figure
11-26)?
A.
Metastatic disease
B.
Hepatocellular carcinoma
C.
Liver cell adenoma
D.
Abscess
Radiologic Findings
11-5. In this case, CT shows a large, fluid attenuation mass in
the posterior dome of the liver with rim enhance-ment and irregular margins
(arrow). In this patient from the United States with fever, the most likely
diag-nosis is pyogenic abscess. If this patient were from an-other country or
had an appropriate travel history, then amoebic or echinococcal abscess could
also be considered (A is the correct answer to Question 11-5).
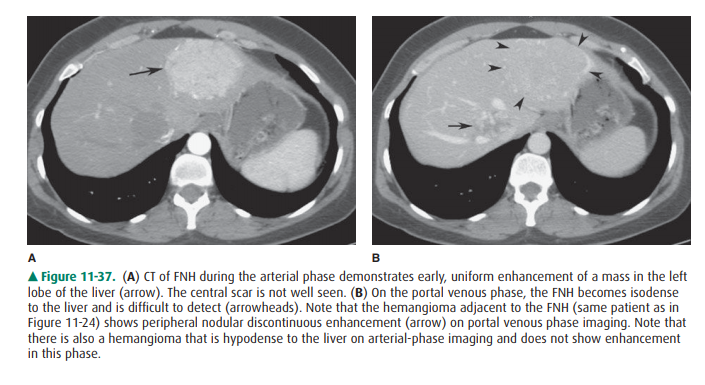
11-6. In this case, CT shows a focal lesion in the central
liver that demonstrates peripheral, nodular, discon-tinuous enhancement
(arrow). Delayed imaging (not shown) would demonstrate centripetal accumulation
(“fill in”) of contrast. These features are characteristic of cavernous
hemangioma (A is the correct answer to Question 11-6).
11-7. In this case, there is a focal lesion occupying the left
lobe of the liver (M), and there is a focal enhancing mass in the pancreatic
tail (T), representing a pancre-atic neoplasm metastatic to the liver (C is the
correct answer to Question 11-7).
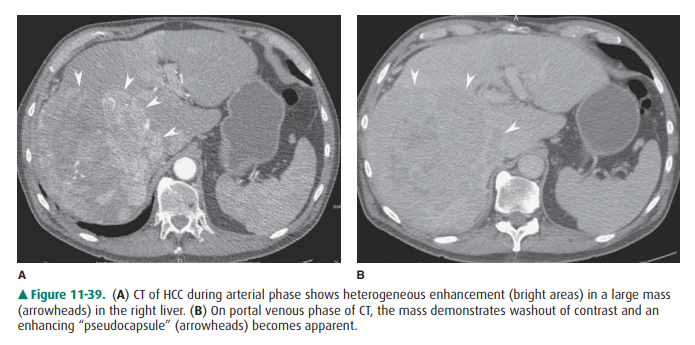
11-8. In this case, CT shows a hypervascular mass (arrow) on
arterial phase CT (Figure 11-26 A). This demonstrates typical washout on portal
venous phase imaging (Figure 11-26 B) with an enhancing “pseudocapsule”
(arrows) of compressed adjacent hepatic tissue. Both are typical features of
HCC (B is the correct answer to Question 11-8).
Discussion
Recognition of the focal or
diffuse nature of liver disease is helpful for sorting out the possible causes.
The two can over-lap, especially because one may lead to another: for example,
cirrhosis can cause hepatocellular carcinoma.
Pyogenic liver abscesses are
relatively common focal in-flammatory lesions of the liver most commonly caused
by bacteria. These lesions have high morbidity and mortality, if undiscovered.
They are multiple in many cases, involving both hepatic lobes. These abscesses
create a severe leukocytosis and can lead to sepsis. Pyogenic abscesses occur
when collections of leukocytes undergo necrosis and become walled off. The
imaging studies, although not definitive, have helpful find-ings. On US, these
lesions often are well demarcated, may be multiloculated, and have fluid
centers and irregular walls. Gas within an abscess creates an echogenic
structure with “dirty” shadowing. On CT, the abscess appears as a low-density
le-sion. Intra-abscess gas occurs in approximately 50% of ab-scesses (Figure
11-27), and enhancement of the border of the lesion after intravenous contrast
infusion also occurs in ap-proximately 50% of abscesses. Low-density edema may
sur-round the abscess (Figure 11-23). Rapid enhancement of the edge of an
abscess after bolus injection of contrast material may be helpful. On
technetium-99m sulfur colloid scans, the abscess appears as a defect within the
liver. MR imaging demonstrates signs of an irregular, fluid-containing lesion,
that is, low signal intensity on T1-weighted examinations and high signal
intensity on T2-weighted examinations. Edema may be visible surrounding the
lesion on T2-weighted images. Pus demonstrates restricted diffusion on MR.

Echinococcal disease is a
parasitic infestation that involves multiple organs, most commonly the liver.
It is endemic in sev-eral regions around the world. The most common form is due
to Echinococcus granulosus, which,
after being ingested by hu-mans, is carried into the gut, transmitted to the
portal circulation, and eventually deposited in the liver, where it develops
into large, occasionally multiloculated, cysts, which may calcify. On US, these
lesions appear as well-defined cysts with regular bor-ders, which may contain
swirling debris and multiple septae. Smaller, “daughter” cysts often surround
them. Small calcifica-tions are present. CT shows similar morphologic findings,
as well as enhancement of the wall after intravenous contrast ma-terial
infusion. Calcifications are crescentic, corresponding to the membranes. MR
imaging shows a cystic mass with a rimlike periphery of low signal intensity on
both T1- and T2-weighted images and with a central matrix of high signal
intensity.
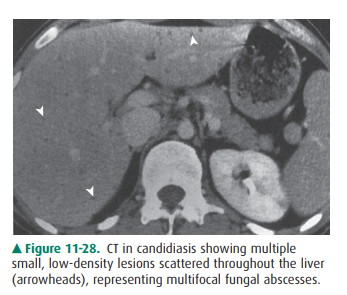
Candidiasis is a fungal disease.
It affects the liver primarily in renal transplant patients and patients who
are immuno-compromised by malignancy or chemotherapy for the malig-nancy. The
organism forms multiple microabscesses, whichcreate the characteristic
appearance on imaging studies. US shows several patterns, the most common being
multiple small hypoechoic structures containing a hyperechoic central spot, the
“bull’s-eye” lesion. Other patterns may occur. CT shows similar multiple small
abscesses (Figure 11-28), in-cluding the bull’s-eye lesion.
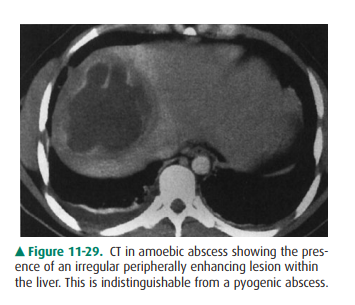
Amebic abscesses are caused by a
parasite, Entamoeba his-tolytica, and
the liver is the most commonly involved organ. The leukocytosis is much less severe than with a pyogenic
ab-scess. Unlike pyogenic abscesses, which require drainage, ame-bic abscesses
can often be cured by medical treatment. Like echinococcal abscesses, amebic
abscesses start when organ-isms reach the liver through the portal circulation
from thebowel. The abscesses may rupture into the peritoneal cavity or even
into the thorax. Imaging studies, including NM, US, and CT, are usually
nonspecific and demonstrate focal defects within the liver (Figure 11-29). The
lesions can resemble echinococcal abscesses. One helpful finding is
intraperitoneal or intrathoracic fluid, if rupture has occurred.
Hemangioma is the most common
benign tumor of the liver and is second only to metastases as the most common
tumor overall within the liver. Hemangiomas are often pe-ripherally located in
the liver, less than 2 cm in diameter, and not associated with abnormalities in
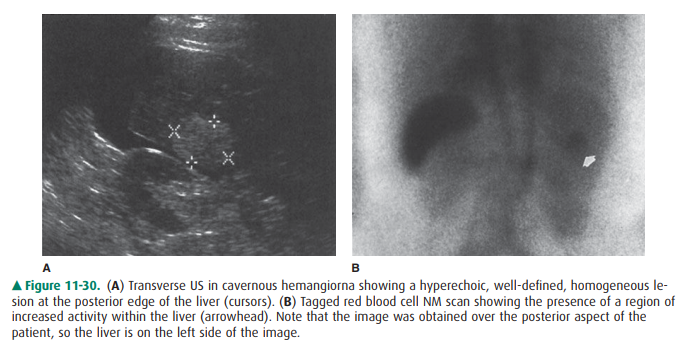
liver function tests. They are most commonly single. On US, they are usually
homoge-neous and hyperechoic (Figure 11-30 A), but an important variant is the
isoechoic mass with hyperechoic periphery. They are often peripheral, with
posterior acoustic enhance-ment. Some large lesions have central scars. CT
shows homo-geneous, low-attenuation lesions, which enhance after intravenous
contrast material administration, have discon-tinuous peripheral nodular
enhancement (called “puddling” of contrast material), and accumulate contrast
material cen-tripetally over a period of several minutes (Figure 11-24). This
finding is most useful when the patient has no known primary tumor; otherwise,
this pattern is more likely due to a metastasis. Technetium-99m labeled red
blood cell scans are diagnostic for hemangioma when early vascular-phase images
show decreased activity and delayed blood-pool scans demon-strate increased
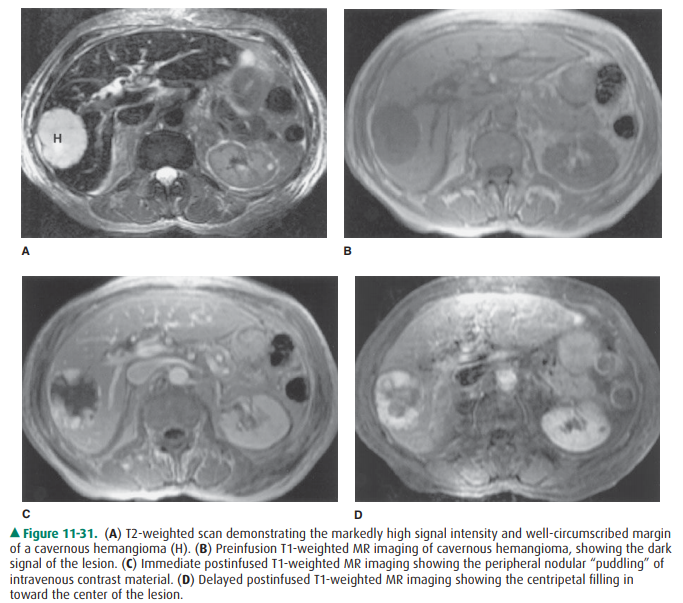
activity at the lesion site (Figure 11-30 B). MR imaging demonstrates lesions
with low signal intensity on T1-weighted scans, which is typical for most
lesions. However, T2-weighted MR imaging demonstrates high signal intensity
similar to that of fluid, which is considered diagnos-tic of hemangioma or
cyst. Intravenous Gd “puddles” in cav-ernous hemangioma and gradually migrates
centripetally toward the center of the lesion (Figure 11-31), analogous to the
distribution of iodinated contrast material in cavernous hemangioma on CT, and
likewise is considered diagnostic of cavernous hemangioma. This puddling in
cavernous heman-gioma is different from the more curvilinear or heteroge-neous
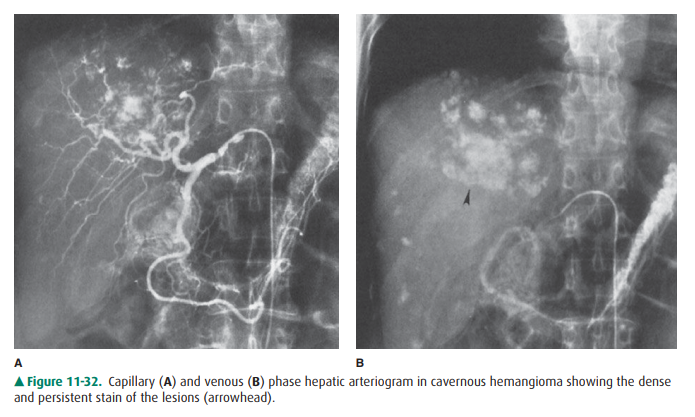
distribution of contrast accumulation seen in malignant tumor. Angiography can
be very helpful, as it shows punctuate collections of contrast material shortly
after injection, analogous to the puddling seen in CT or MR imag-ing (Figure
11-32 A). These collections become denser, usu-ally within a minute, because
contrast puddles in the vascular spaces of the tumor (Figure 11-32 B). On all
modalities with intravenous contrast, hemangiomas usually enhance early and
retain contrast.
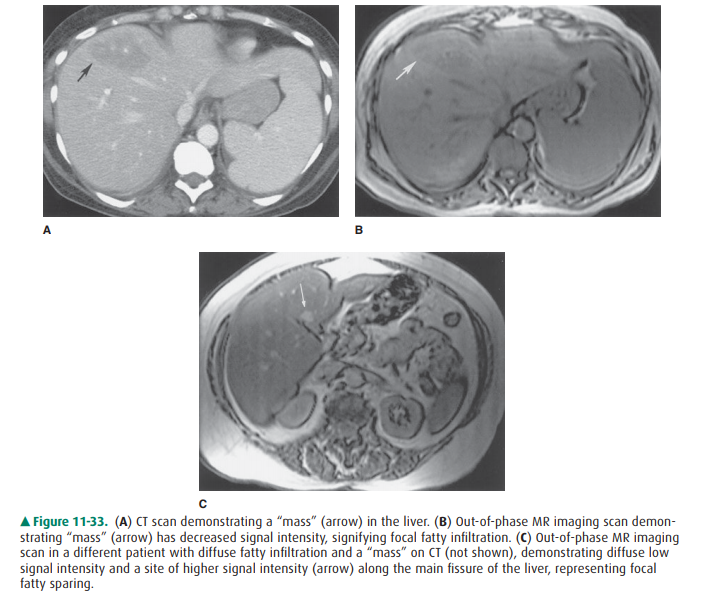
Although typically diffuse,
steatosis of the liver can pres-ent as focal deposits of fat. Furthermore,
sometimes steatosis can present as the reverse, namely, residual focal islands
of hepatic tissue unaffected by fatty deposition. Both of these conditions can
be confusing because they may resemble focal solid masses including tumor on CT
or US. MR imag-ing is the most accurate means to identify sites of focal fat or
focal fatty sparing. In particular, a pulse sequence called “out-of-phase”
T1-weighted imaging, which emphasizes the presence of fat intermixed with any
host water-containing tissue, is very sensitive in the detection of the
presence or ab-sence of fat within focal fat or focal fatty sparing,
respec-tively. Wherever fat is intermixed with water-containing parenchyma,
there is loss of signal intensity on out-of-phase images. Therefore, focal
fatty infiltration appears as sites of relative signal loss, whereas focal
fatty sparing appears as sites of relative signal gain (Figure 11-33). This
imaging technique is the most sensitive and specific cross-sectional modality
for characterizing focal fatty distribution, a very common condition.
The liver is a common and important
site for metastatic disease. As many as 25% to 50% of cancer patients have
liver metastases at autopsy. Most tumors metastasize to the liver, and
metastasis to the liver strongly affects the stage of the tumor and prognosis
of the patient. Most metastases are multiple, diffusely distributed, variable
in size, and solid. They may be necrotic and appear more cystic. Liver
metastases may be present even when both general and specific serum markers for
tumor, such as liver function tests and carcinoembryonic antigen, are normal.
Metas-tases may be poorly vascularized or highly vascular, a dif-ference that
affects their appearance after intravenous contrast administration. Metastases
from renal cell carci-noma, thyroid carcinoma, carcinoids, and neuroendocrine
tumors are classically hypervascular. Mucin-producing carcinomas, such as
breast and colon carcinoma, fre-quently produce calcification, which can be
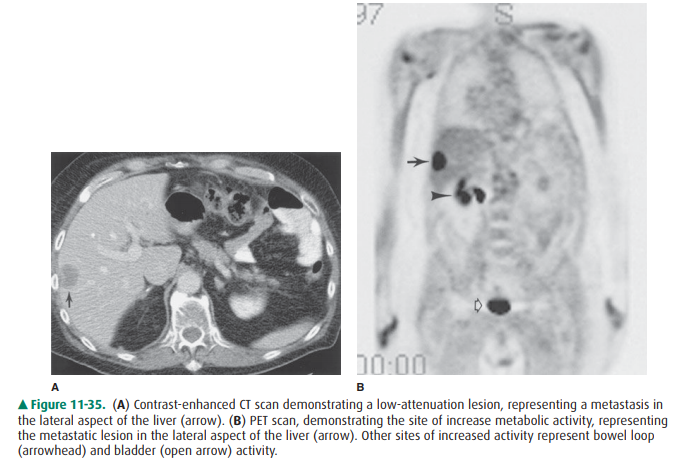
detected with imaging studies. Metastases are almost always evaluated with
cross-sectional imaging studies. However, more re-cently, PET has been used to
detect certain malignancies, including liver metastases. Because the liver
physiologically takes up the radiopharmaceutical used in PET, metastatic
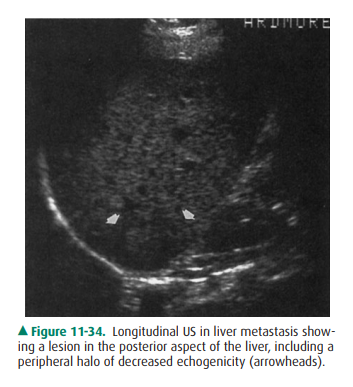
lesions can be obscured. Although US can evaluate for liver metastases when
used by skilled operators, it is limited by relative insensitivity to subtle
lesions, especially against the background of preexisting liver disease. On US,
metastasesare usually hypoechoic, poorly defined, and hypovascular, and they may
have a peripheral halo (Figure 11-34). Some types, such as breast cancer, may
be diffusely distributed in minute form. In most institutions, CT is used to
survey and monitor patients for liver metastases, because CT can de-tect
metastases and is probably the most useful technique for evaluating
extrahepatic disease. On CT, metastases are usually multifocal, of low
attenuation, and often better shown after administration of intravenous
contrast mate-rial when compared to preinfusion scans (Figure 11-35). Again,
some forms present as diffuse inhomogeneity. Be-cause of its sensitivity and
potential for characterizing some lesions specifically, MR imaging may become
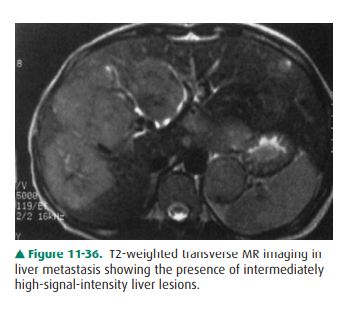
the pre ferred technique for detecting and characterizing liver metastases.
Lesions have low signal intensity on T1-weighted images and higher signal
intensity (but never as high as in cavernous hemangioma) on T2-weighted studies
(Figure 11-36). Certain lesions, such as melanoma, carci-noid, and endocrine
tumors of the pancreas, have very high signal with strongly T2-weighted scans.
Hepatocyte-specific contrast agents, such as gadoxetate disodium, are also
being used to detect metastases. Because metastatic le-sions do not have normal
hepatocytic function, they do not retain the contrast, making them conspicuous
as areas of relatively decreased enhancement compared to the normal surrounding
liver.
Angiosarcoma is a rare, highly
vascular tumor of the liver. It is seen in patients who have had an
occupational ex-posure to certain chemicals, particularly polyvinyl chloride or
thorotrast. If lesions rupture, they may produce serious hemorrhagic sequelae.
On US, angiosarcoma is usually hy-poechoic. Sometimes the attendant fibrosis so
obscures the tumor that it is impossible to identify. On CT, the lesions have
low attenuation, may enhance markedly, and, if arising in the presence of
thorotrast, can displace and distort the thorotrast collections.
Focal nodular hyperplasia (FNH)
and liver cell adenoma are easily confused. Both are histologically benign liver
disorders that produce single or multiple lesions. Both processes can occur in
young adults. On imaging studies, they can resemble primary or metastatic liver
tumors. How-ever, some important differences pertain. FNH is probably a
hamartoma of the liver, that is, a localized overgrowth of mature cells that
are identical to the types constituting the liver and contain fibrous tissue,
blood vessels, bile ducts, and occasional well-differentiated hepatocytes.
Adenoma is a true benign tumor composed of one tissue element of the liver, the
hepatocyte. FNH often contains a central fibrotic scar. Adenoma is associated
with the use of oral contracep-tives, whereas FNH probably is not. Adenoma,
unlike FNH, tends to undergo hemorrhage, and thus to present as acute abdominal
pain. US is nonspecific in studying FNH. Ade-noma is usually hyperechoic but
heterogeneous. On CT, FNH is transiently but markedly and uniformly
hypervas-cular, and the central scar may be seen (Figure 11-37). Adenoma
usually shows low density, may demonstrate hemor-rhage as high-density
collections on preinfusion scans, and enhances variably. On Tc-sulfur colloid
NM scans, FNH can show increased, decreased, or normal activity compared to
that of liver. Adenoma usually shows no increased uptake in NM studies, but
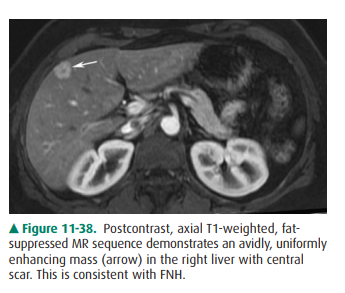
this varies. FNH has low signal intensity on T1-weighted MR imaging and
slightly high signal intensity on T2-weighted images. As on CT, it shows
uniformly early enhancement and the central scar (Figure 11-38). If the central
scar is present, it may exhibit high signal intensity on T2-weighted images.
Adenoma, like many lesions, has a nonspecific appearance of low signal
intensity on T1-weighted examinations and slightly high signal intensity on
T2-weighted examinations. Hemorrhage is recognizable as high signal intensity
on T1-weighted images. Angiographi-cally, FNH is hypervascular with radiating
branches that produce a “spoke-wheel” appearance. Adenoma has a vari-able
angiographic appearance but is generally less vascular than FNH.
Hepatocellular carcinoma (HCC),
or hepatoma, is a primary malignancy of the liver. It is found in older
cirrhotic patients in the United States and in younger patients in areas of the
Far East and Africa, where it is endemic. Chronic hepatitis B and C infection and
exposure to aflatoxin predispose to for-mation of hepatocellular carcinoma. On
imaging studies, hepatocellular carcinoma appears as (1) a single predomi-nant
lesion (most common form), (2) a predominant lesion with multiple, smaller,
surrounding daughter lesions, or (3) diffuse tumor. Portal vein invasion by the
tumor in any form is relatively common and can aid in distinguishing
hepato-cellular carcinoma from other lesions. On US, hepatocellular carcinoma
is most commonly a discrete lesion with in-creased, similar, or decreased
echogenicity in comparison to that of liver. On CT, lesions are most commonly
of low den-sity and may enhance if fast scans in the arterial phase are
performed after contrast material administration (Figure 11-39). Portal venous
thrombosis can be seen, and preexist-ing cirrhosis or thorotrast can be
demonstrated. MR imag-ing findings are similar to those of CT, but as with CT,
the lesion is inhomogeneous.
Related Topics