Chapter: Introduction to Human Nutrition: Measuring Food Intake
Evaluation of food intake data
Evaluation of food intake data
Recognizing the impact of underreporting
Dietary studies are often conducted in order to compare food and nutrient intake between different groups in the population, to determine the proportion of individuals at risk of dietary inadequacy or excess, or to determine the habitual intake of individuals.
In each case it is important first to assess the valid-ity of the data. For most investigators the use of the Goldberg cut-offs is currently the most practical option to indicate whether, and to what extent, the results are likely to be biased. However, to use the Goldberg cutoffs effectively dietary studies need to include:
●measurements of weight and height, to be able to estimate BMR from equations
●questions on activity level to provide guidance on suitable PALs for evaluation of both mean and indi-vidual data.
While the characteristics of “true” underreporters (as opposed to LERs identified by a single EI:BMR cut-off) remain to be confirmed, the associations consistently observed between high BMI, weight con-sciousness, and low energy reporting suggest that, in addition, questions on self-perception of body shape, dieting, and dietary restraint may also help in identi-fying true underreporters.
It cannot be overemphasized that it is always important to examine all dietary intake data critically because false conclusions generate false hypotheses that may take years to be disproved.
A classic case was the luxus konsumption hypoth-esis, namely that lean individuals are energy prodigal and obese individuals energy efficient. This hypothe-sis was generated by studies apparently showing that obese persons did not consume more energy than their lean controls. Subsequently, DLW studies dem-onstrated beyond doubt that obese persons recruited for studies of obesity grossly underreported their food intake.
Allowing for the effects of underreporting
Although techniques for handling biased dietary data have been developed, most are complex However, the following suggestions serve to promote critical examination of data and wariness in drawing conclusions.
If the proportion of individuals who report implausibly low intakes of energy differs between population subgroups of interest, then any comparisons between them that do not take this into account will be biased. One way to draw attention to the possibility of bias between groups is to report not only the mean or median energy intake of the groups being compared but also the EI:BMR ratio. If differences are evident then the groups should be compared both with and without LERs included. One problem that arises is that by subdividing the groups the sample size is reduced and imprecision increased, so that a difference of biological significance may be missed, not because it does not exist but because the sample size is too small to detect it statistically.
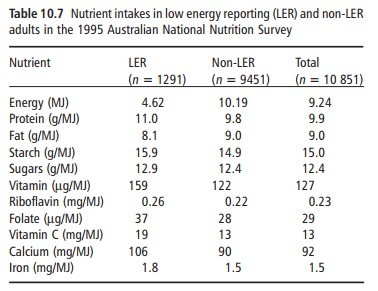
When dietary inadequacy or excess is the question of interest, it is again important to consider LERs separately. Energy intake is highly correlated with the intake of many nutrients and, consequently, intake of nutrients is also likely to be underestimated in underreporters and more likely to indicate inadequacy relative to recommendations for nutrient intake. An alternative approach is to compare nutrient intake per unit energy for both groups. If this differs between LERs and the rest of the popula-tion it provides evidence that the reporting of food intake is also likely to be selective. The nutrients for which significant differences are observed can also provide clues as to the types of food likely to be involved.
Studies that have examined macronutrient intake between respondents above and below a given value of EI:BMR have generally found that the percentage of energy derived from protein was higher and that from fat lower in LERs than in non-LERs. Results for carbohydrate have been more variable, but, when separated into starch and sugars, energy from starch tended to be higher and energy from sugars lower in LERs. Nutrient density also tends to be higher for most nutrients in LERs than in non-LERs, providing further indication of differences in food patterns between the two groups.

Table 10.7 illustrates these general trends with data from the 1995 Australian National Nutrition Survey. Twelve per cent of men and 21% of women in this survey were identified as LERs. The median energy intake in non-LERs was approximately 6% higher in men and 10% higher in women than for all men and women, and vitamin and mineral intake approxi-mately 5–10% higher in non-LER men and 6–15% higher in non-LER women. Differences of this order of magnitude are important in the context of the assessment of dietary adequacy.
Relatively few studies have reported on differences in foods eaten, but there appears to be a general ten-dency for LERs to report more foods such as meat, fish, vegetables, salads, and fruit, and fewer cakes, biscuits, sugar, confectionery, and fats.
Related Topics