Chapter: Introduction to Human Nutrition: Measuring Food Intake
Biological measures to validate energy and nutrient intake
Biological measures to validate energy and nutrient intake
It is now clearly recognized that to assess the validity of any dietary method, including weighed records, it is necessary to compare the dietary data with one or more objective measures that reflect but are independent of food intake. At the group level such measures include food supply or food expenditure data, and at the individual level biochemical or physiological mea-sures that reflect energy and nutrient intake. The latter are often referred to as biological or biochemical markers and include energy expenditure, urinary breakdown products of protein, sodium, and potas-sium, plasma levels of vitamins, tissue levels of miner-als, and the fatty acid composition of subcutaneous adipose tissue.
Biological marker – any biochemical index in an easily accessible biological sample that in health gives a predictive response to a given dietary component. (Bingham, 1987).
Biological markers are assumed to be objective, i.e., they do not rely on memory, or the respondents’ ability to express themselves, and are free of biases introduced by the presence of the interviewers. These measures are also subject to errors of measurement and classification, but these errors are not related to the errors inherent in dietary intake assessment methodologies.
The three most widely used measures to assess the validity of dietary intake data are urinary nitrogen to validate protein intake, energy expenditure as mea-sured by the doubly labeled water (DLW) method to validate energy intake in weight-stable individuals, and the ratio of energy intake to basal metabolic rate to identify “plausible” records of food intake.
Urinary nitrogen
One of the first to suggest an external measure as a means of validating dietary intake data was Isaakson (1980), who proposed urinary nitrogen as an inde-pendent measure of protein intake according to the equation:
Reported protein intake (g) = (24 hour urinary N + 2) × 6.25 (g)
Like the 24 hour recall, a single 24 hour urine collec-tion does not necessarily reflect what is “usual.” However, it appears that urinary nitrogen excretion is less variable from day to day than dietary protein intake, and that while 16 days of food intake are needed to assess habitual protein intake only eight 24 hour urine collections are needed to assess nitrogen excretion with the same level of confidence.
Although fewer 24 hour urine collections may be needed they are, in general, no more acceptable to respondents than 24 hour food records and also require access to laboratory facilities. Nevertheless, they can provide a practical independent assessment, not only of protein but also of potassium and sodium intake.
Very few validation studies have attempted to eval-uate how well the different methods rank individuals. It has been observed that the correlation between urinary nitrogen and dietary nitrogen measured by diet records was better (0.65 and 0.79) than between urinary nitrogen and dietary nitrogen measured by food frequency questionnaires (0.15 and 0.24).
Doubly labeled water method
The DLW technique allows the measurement of energy expenditure in free-living respondents over several days with minimal inconvenience to the respondent and with a high level of accuracy and precision. Under controlled conditions the DLW method gives a small overestimate of 2–3% compared with whole body calorimetry, and under field condi-tions bias is not expected to exceed 5%.
The DLW method requires that the respondent drinks a small measured dose of water enriched with naturally occurring stable isotopes of deuterium and 18O. The two isotopes disperse throughout the body, and are metabolized and then gradually lost from the body. Since the deuterium labels the body water pool, and the 18O labels both the water and the bicarbonate pools, the difference between the disappearance rates of deuterium and 18O can be used to calculate carbon dioxide production. The level of both isotopes is determined, using mass spectrometry, in a small sample of urine collected each day for between 5 and 28 days. Energy expenditure is calculated from carbon dioxide production using calorimetric equations.
Using the DLW technique several investigators have compared self-reported dietary energy intake with energy expenditure based on the equation:
Energy expenditure (EE) = Energy intake (EI) ± Change in the body energy store
Differences between measured energy intake and expenditure varied from –44% to +28% depending on the population subgroup studied. This finding confirms the need to include one or more indepen-dent measures of validity in all dietary studies to ascertain the level applicable to the particular group under study, since it is not readily predicted on the basis of gender, age, or body mass index (BMI).
The main advantage of the DLW method is that it makes minimal demands on the respondents and does not in any way interfere with their normal daily activities and therefore their habitual level of energy expenditure. Its main disadvantage is that the cost of the DLW required for each estimate is exceedingly high and the method also requires access to sophisti-cated laboratory equipment for mass spectrometric analysis. It is, therefore, not available for use on a routine basis for the validation of dietary intake data.
Ratio of energy intake to basal metabolic rate
Because of the limitations of the DLW method, another approach that is used compares the energy intake (EI) reported from published studies with the presumed requirements for energy expenditure, both intake and expenditure being expressed as multiples of the basal metabolic rate (BMR). The relevant equation is:
EI:BMR = EE:BMR (PAL)
where PAL is the physical activity level. To determine whether reported energy intake is a “plausible” measure of actual diet during the measurement period (i.e., represents either the habitual diet or is a low/ high energy intake obtained simply by chance) an equation was developed by Goldberg and colleagues (1991) to calculate the 95% confidence limits of agreement between EI:BMR and PAL. This equation allowed for variation in EI, BMR, and PAL and also for the length of the dietary assessment period and study sample size.
For a group, if mean reported EI:BMR is below the lower 95% confidence limit (cut-off) for the given study period and sample size, then there is definitely bias to the underestimation of energy intake.
However, the identification of individual under-reporters is much more difficult, since reported EI can deviate quite markedly from energy expenditure (EE) before it falls outside the limitations of the methods. Figures 10.7 and 10.8 illustrate the limitations of both techniques. Figure 10.7 shows the energy intake and DLW EE of 264 women. The solid lines indicate EI: EE of 0.76 and 1.24. These are the 95% confidence limits of agreement between EI and EE, allowing for day-to-day variation in food intake and within-subject variation on repeat DLW measurements. Only women with an EI:EE ratio above 1.24 can be confidently
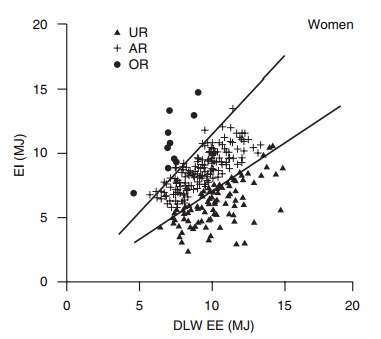
Figure 10.7 Reported energy intake (EI) against energy expenditure (EE) measured by doubly labeled water (DLW) in 264 women aged 18–90 years. The solid lines represent the 95% confidence limits of the expected agreement between EI and EE (±24%). UR, underreport-ers; AR, acceptable reporters; OR, overreporters (after Black, 2000, reproduced with permission).
identified as overreporters, and those below 0.76 as underreporters. In Figure 10.8, the same data are expressed as EI:BMR and EE:BMR, and each respon-dent is represented by the same symbol as in Figure 10.7. The line at EI:BMR = 1.05 indicates the Gold-berg cut-off for n = 1 and PAL = 1.55, which has been widely used to identify low energy reporters (LERs). These data demonstrate that only about 50% of underreporters (as defined by EI:EE = 0.76) are iden-tified as LERs. The second line at EI:BMR of 1.35 is the Goldberg cut-off for n = 1 and PAL = 1.95. This cut-off identifies more of the underreporters, but also includes some of the acceptable reporters. To improve on identification of underreporters it is necessary to have information on physical activity to enable respondents to be classified into different levels of activity and to calculate cut-offs appropriate for each activity level.
While the ability to separate the food and nutrient intake data of those with and without plausible energy intakes is a very important step in the evaluation of dietary intake data, it does have limitations.
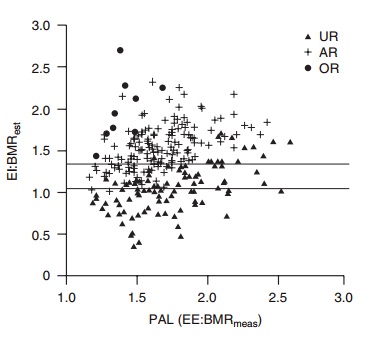
Figure 10.8 Energy intake–estimated basal metabolic rate (EI:BMRest) against physical activity level [PAL; energy expenditure–measured BMR (EE:BMRmeas)]. Respondents are designated as acceptable report-ers (AR), overreporters (OR), or underreporters (UR) by the direct com-parison of EI:EE. The horizontal lines indicate the lower Goldberg cut-off for PAL = 1.55 and 1.95, 7 day records, and n = 1 (after Black, 2000, reproduced with permission).
· The equations for the estimation of BMR have been derived for Western populations and their
●The ratio does not take differences in physical activ-ity into account (Black, 2000).
●Using a single cut-off point to identify under-reporters has been found to have poor sensitivity for underreporting (fails to identify underreport-ers), especially at high levels of energy intake (Black, 2000).
●Cut-off values differ among studies. Thus it is dif-ficult to select an appropriate value and to compare studies.
●Cut-off values apply only to individuals in energy balance. They cannot be applied to growing chil-dren or to adults trying to lose weight (Gibson, 2005).
Characteristics of low energy reporters
A number of studies have examined the characteris-tics of low energy reporters (LERs). Associations between low energy reporting and a large number of factors including high body weight, high BMI, obesity, dieting, and awareness of body image were found in every study that looked at these measures. Associations with other sociodemographic factors of the type nor-mally included in nutrition studies, such as gender, age, education, socioeconomic status, and smoking, were inconsistent.
Related Topics