Chapter: 11th Zoology : Chapter 7 : Body Fluids and Circulation
Electrocardiogram (ECG)
Electrocardiogram (ECG)
An
electrocardiogram (ECG) records the electrical activity of the heart over a
period of time using electrodes placed on the skin, arms, legs and chest. It
records the changes in electrical potential across the heart during one cardiac
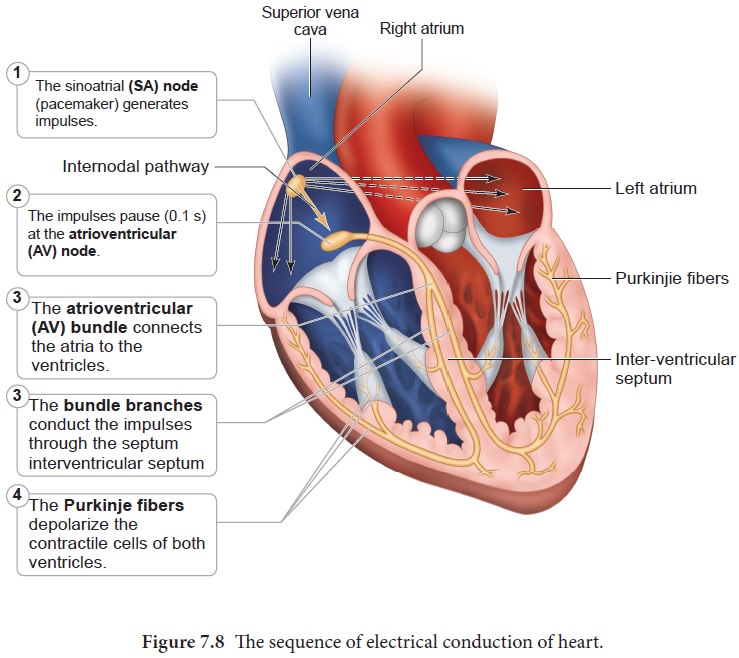
cycle. The special flap of muscle which initiates the heart beat is called as
sinu-auricular node or SA node in the right atrium. It spreads as a wave of
contraction in the heart. The waves of the ECG are due to depolarization and
not due to contraction of the heart. This wave of depolarisation occurs before
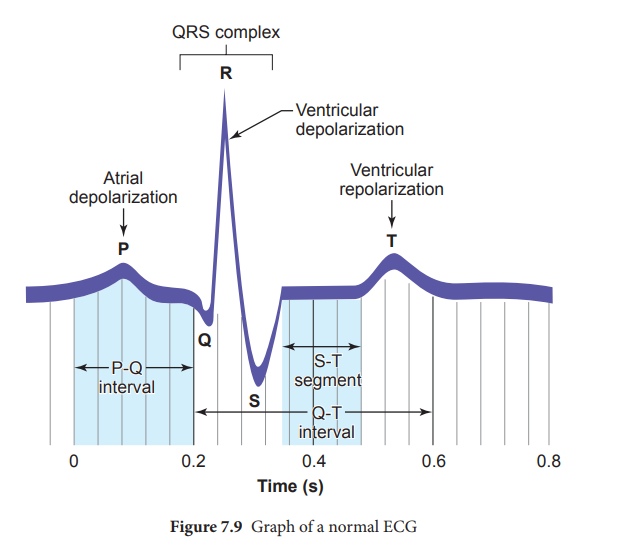
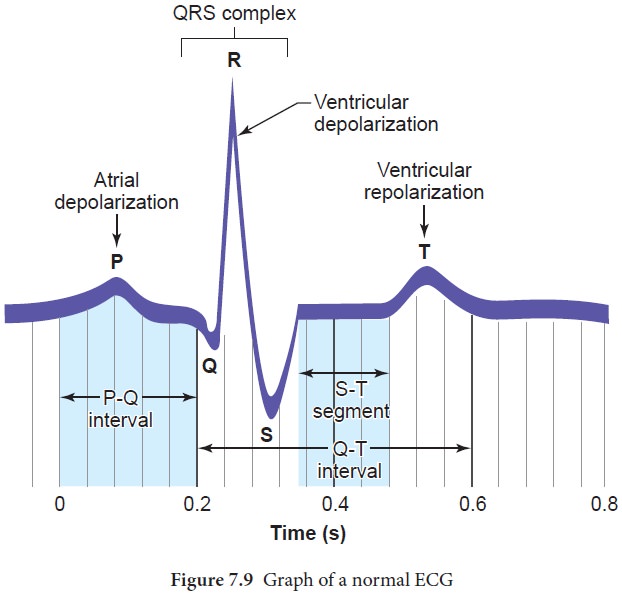
the beginning of contraction of the cardiac muscle. A normal ECG shows 3 waves
designated as P wave, QRS complex and T wave as shown in Figure 7.9 and the
stages of the ECG graph are shown in Figure 7.10.
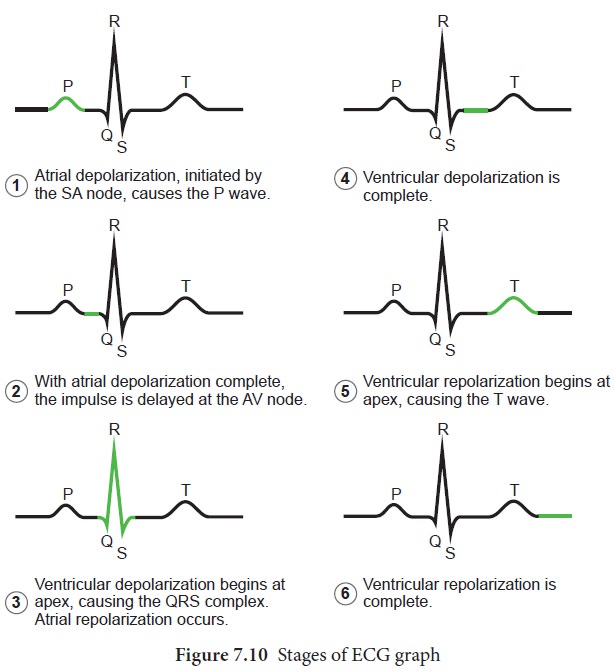
P Wave (atrial depolarisation)
It is a
small upward wave and indicates the depolarisation of the atria. This is the
time taken for the excitation to spread through atria from SA node. Contraction
of both atria lasts for around 0.8-1.0 sec.
PQ Interval (AV node delay)
It is the
onset of P wave to the onset of QRS complex. This is from the start of
depolarisation of the atria to the beginning of ventricular depolarisation. It
is the time taken for the impulse to travel from the atria to the ventricles
(0.12-0.21sec). It is the measure of AV conduction time.
QRS Complex (ventricular depolarisation)
No
separate wave for atrial depolarisation in the ECG is visible. Atrial
depolarisation occurs simultaneously with the ventricular depolarisation. The
normal QRS complex lasts for 0.06-0.09 sec. QRS complex is shorter than the P
wave, because depolarisation spreads through the Purkinjie fibres. Prolonged
QRS wave indicates delayed conduction through the ventricle, often caused due to
ventricular hypertrophy or due to a block in the branches of the bundle of His.
ST Segment
It lies
between the QRS complex and T wave. It is the time during which all regions of
the ventricles are completely depolarised and reflects the long plateau phase
before repolarisation. In the heart muscle, the prolonged
depolarisation is due to retardation of K+ efflux and is responsible for the
plateau. The ST segment lasts for 0.09 sec.
T wave (ventricular depolarisation)
It
represents ventricular depolarisation. The duration of the T wave is longer
than QRS complex because repolarisation takes place simultaneously throughout
the ventricular depolarisation.
Related Topics