ER-Modeling Diagram Notations, Example - ER-Diagram | 12th Computer Applications : Chapter 3 : Introduction to Database Management System (DBMS)
Chapter: 12th Computer Applications : Chapter 3 : Introduction to Database Management System (DBMS)
ER-Diagram
ER-Diagram
ER Diagram presents data visually on how they are
related to each other. This model follows separate notations for representing
data into entities, attributes and relationship between the entities.
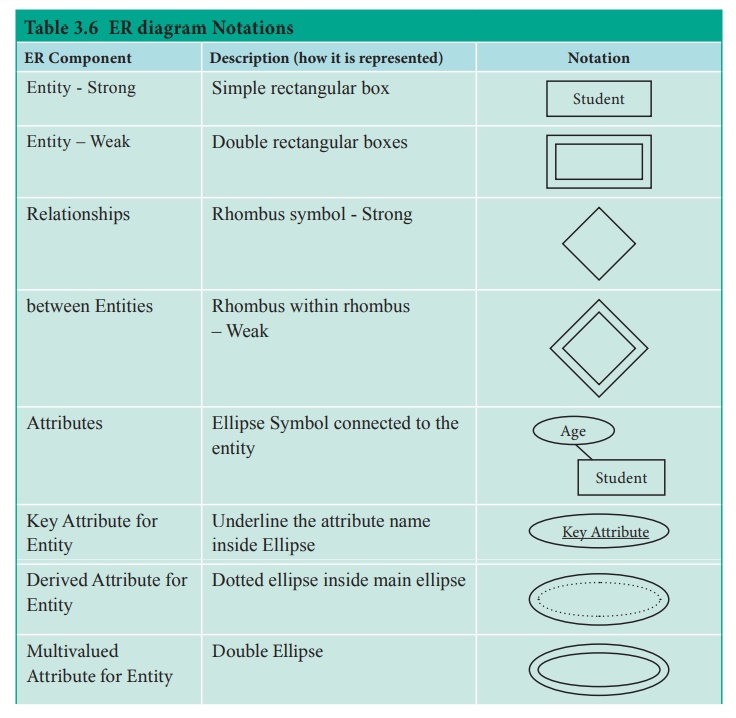
ER-Modeling Diagram Notations
Entities, Attributes and Relationship forms the
components of ER Diagram and the defined symbols and shapes are summarized
below in Table 3.6

Example
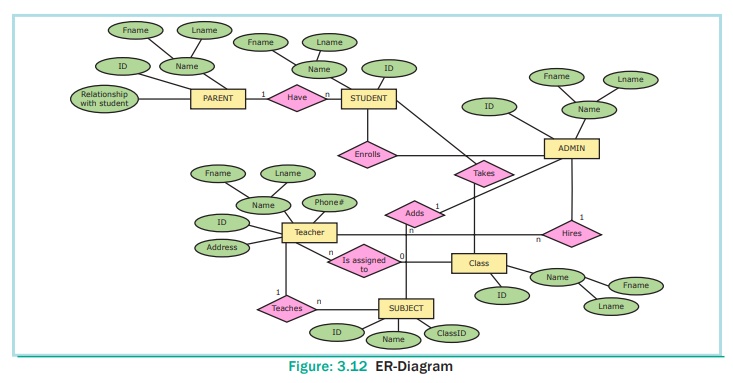
Fig 3.12 is an example of ER Diagram for the scenario of School Management System. We have many entities like Parent, student, Admin, Teacher, class and subjects.

The attributes of few entity is
given below:
Parent – Name, Id, Fname, Lname.
Student – Id, Name, Fname, Lname.
Teacher – Name, Id, Phone#, Address.
The relationships that exist between the entities
are as follows:
• Parent HAVE
Student
• Admin ENROLLS
Student
• Admin HIRES
Teacher
• Admin ADDS
Subject
• Teacher TEACHES
Subject
• Teacher IS
ASSIGNED TO Class
Key Attributes are listed with underline.
Related Topics