Statistics - Box plot | 11th Statistics : Chapter 6 : Measures of Dispersion
Chapter: 11th Statistics : Chapter 6 : Measures of Dispersion
Box plot
Box
plot
A box plot can be used to graphically represent the data set. These
plots involve five specific value.
(i)
The lowest value of the data set (i.e., minimum), (ii) Q1 (iii) The
median (iv) Q3 , (v) The highest value of the data set (i.e maximum)
These value are called a five-number summary of the data set.
A box plot is a graph of a data
set obtained by drawing a horizontal line from the minimum data value to
Q1 and a horizontal line from Q3 to the maximum data
value, and drawing a box by vertical lines passing through Q1 and Q3,
with a vertical line inside the box passing through the median or Q2.

Description of boxplot
1.
If the median is near the center of the box, the distribution is
approximately symmetric
2.
If the median falls to the left of the center of the box, the
distribution is positively skewed.
3.
If the median falls to the right of the center of the box, the
distribution is negatively skewed.
4.
If the lines are about the same length, the distribution is
approximately symmetric
5.
If the right line is larger than the left line. the distribution
is positively skewed.
6.
If the left line is larger than the right line. the distribution
is negatively skewed.
Remark:
(i) The line drawn from minimum value of the dataset to Q1 and Q3 to the maximum value of the data set is called whisker.
(ii) Box plot is also called Box – Whisker plot.
(iii) A box and whisker plot illustrate the spread of the distribution and also gives an idea of the shape of the distribution
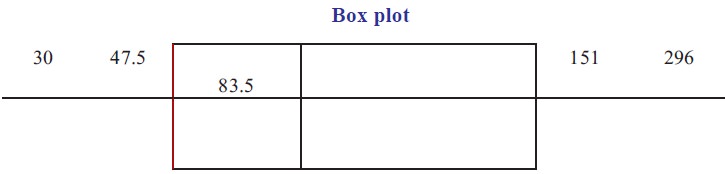
Example 6.20
The following data gives the Number of students studying in XI
standard in 10 different schools 89,47,164,296,30,215,138,78,48,39 construct a
boxplot for the data.
Solution:
Step 1 : Arrange the data in order
30,39,47,48,78,89,138,164,215,296
Step 2 : Find the median
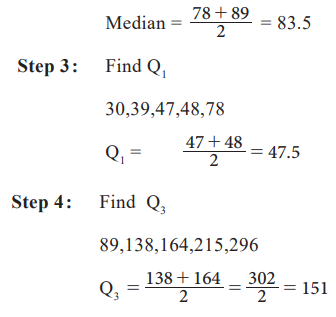
Step 5 : Find
the minimum and maximum values.
Step 6 : Locate
the lowest value, Q1, median, Q3 and the highest value on
the scale.
Step 7 : Draw a
box through Q1 and Q3
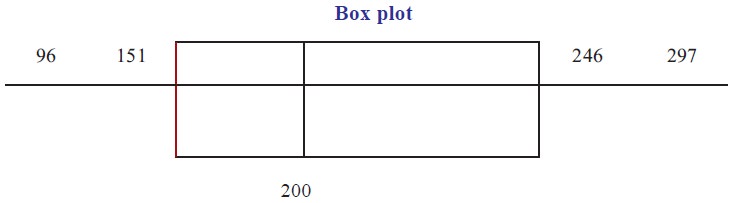
Example 6.21
Construct a box –whisker plot for the following data
96, 151, 167, 185, 200, 220, 246, 269, 238, 252, 297, 105, 123,
178, 202
Solution:
Step 1 : Arrange
the data in code
96,105,123,151,167,178,185,200,202,220,238,246,252,269,297.
Step 2 : Find
the Median
8th term Median = 200
Step 3 : Find Q1
(middle of previous terms of 200)
96,105,123,151,167,178,185
Q1 =151
Step 4 : Find Q3
(middle of successive terms of 200)
202,220,238,246,252,269,297
Q3 =246
Step 5 : Minimum
value = 96, Maximum Value = 297
Step 6 : Draw a
scale for the data on the x axis
Step 7: Locate the five
numbers in the scale and draw a box around
Related Topics