Statistics - Skewness and Kurtosis | 11th Statistics : Chapter 6 : Measures of Dispersion
Chapter: 11th Statistics : Chapter 6 : Measures of Dispersion
Skewness and Kurtosis
SKEWNESS AND KURTOSIS
There are two other comparable characteristics called skewness
and kurtosis that help us to understand a distribution.
Skewness
Skewness means ‘lack of symmetry’. We study skewness to have an idea about the shape of the
curve drawn from the given data. When the data set is not a symmetrical distribution,
it is called a skewed distribution and such a distribution could either be
positively skewed or negatively skewed.

The concept of skewness will be clear from the following three
diagrams showing a symmetrical distribution, a positively skewed distribution
and negatively skewed distribution.
We can see the symmetricity from the following diagram.
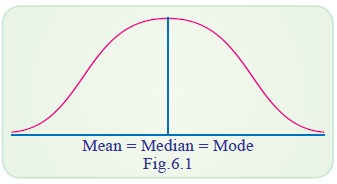
(a) Symmetrical Distribution
It is clear from the diagram below that in a symmetrical
distribution the values of mean, median and mode coincide. The spread of the
frequencies is the same on both sides of the centre point of the curve.
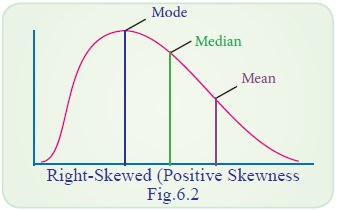
(b) Positively Skewed Distribution
In the positively skewed distribution the value of the mean is
maximum and that of mode is least – the median lies in between the two. In the
positively skewed distribution the frequencies are spread out over a greater
range of values on the high-value end of the curve (the right-hand side) than
they are on the low value end. For a positively skewed distribution,
Mean>Median> Mode
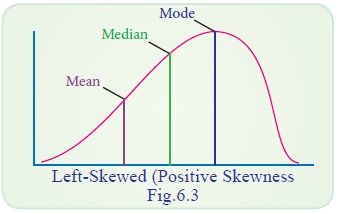
(c) Negatively skewed distribution
In a negatively skewed distribution the value of mode is maximum
and that of mean least-the median lies in between the two. In the negatively
skewed distribution the position is reversed, i.e., the excess tail is on the
left-hand side.
It should be noted that in moderately symmetrical distribution
the interval between the mean and the median is approximately one-third of the
interval between the mean and the mode. It is this relationship which provides
a means of measuring the degree of skewness.
d. Some important Measures of Skewness
(i) Karl-Person
coefficient of skewness
(ii) Bowley’s
coefficient of skewness
(iii) Coefficient of
skewness based on moments
(i) Karl-Person coefficient of skewness
According
to Karl-Person the absolute measure of
skewness = mean – Mode.
Karl-Pearson
coefficient of skewness = Mean – Mode / S.D
Example 6.16
From the known data, mean = 7.35, mode=8 and Variance = 1.69
then find the Karl-Pearson coefficient of skewness.
Solution:

(ii) Bowley’s coefficient of skewness
In Karl Pearson method of measuring skewness the whole of the
series is needed. Prof. Bowley has suggested a formula based on position of
quartiles. In symmetric distribution quartiles will be equidistance from the
median. Q2 – Q1 = Q3 – Q2
, but in skewed distributions it may not happen. Hence
Bowley’s coefficient of skewness (SK) = 
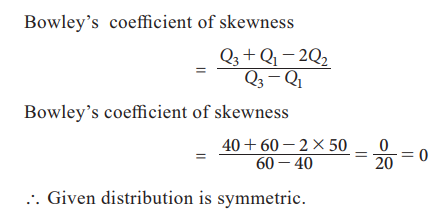
Example 6.17
If
Q1 = 40, Q2=50, Q3=60, Bowley’s coefficient of
skewness
Solution:
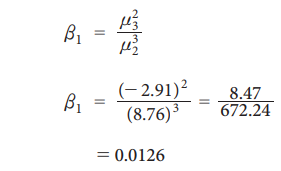
(iii) Measure of skewness based on Moments
The Measure of skewness based on moments is denoted by β1
and is given by

Example 6.18
Find β1 for the following data μ1=0, μ2=8.76,
μ3=-2.91
Solution:
Kurtosis
Kurtosis in Greek means ‘bulginess’. In statistics kurtosis refers to
the degree of flatness or peakedness in the region about the mode of a
frequency curve. The degree of kurtosis of distribution is measured relative to
the peakedness of normal curve. In other words, measures of kurtosis tell us
the extent of which a distribution is more peaked or flat-topped than the
normal curve.
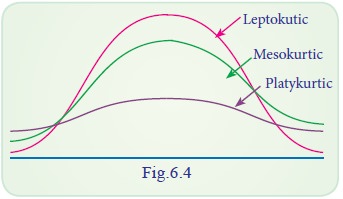
The following diagram illustrates the shape of three different
curves mentioned below:
If a curve is more peaked than the normal curve, it is called ‘leptokurtic’. In such a case items
are more closely bunched around the mode. On the other hand if a curve is more flat-topped
than the normal curve, it is called ‘platykurtic’. The bell shaped normal curve itself is know
as ‘mesokurtic’. We can find how much
the frequency curve is flatter than the normal curve using measure of kurtosis.
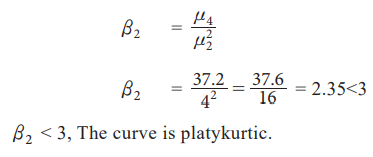
Measures of Kurtosis
The
most important measure of kurtosis is the value of the coefficient. It is
defined as: coefficient of kurtosis β2=μ4 / μ22

Example 6.19
Find
the value of β2 for the following data μ1 = 0, μ2 = 4,
μ3
= 0, μ4 = 37.6.
Solution:
Related Topics