Statistics - Absolute Measures | 11th Statistics : Chapter 6 : Measures of Dispersion
Chapter: 11th Statistics : Chapter 6 : Measures of Dispersion
Absolute Measures
Absolute
Measures
It involves the units of measurements of the observations. For example, (i) the dispersion of salary of employees is expressed in rupees, and (ii) the variation of time required for workers is expressed in hours. Such measures are not suitable for comparing the variability of the two data sets which are expressed in different units of measurements.
1. Range
Raw Data:
Range is defined as difference between the largest and smallest
observations in the data set. Range(R) = Largest value in the data set (L)
–Smallest value in the data set(S)
R= L - S
Grouped Data:
For grouped frequency distribution of values in the data set,
the range is the
difference between the upper class limit of the last class interval and the
loawer class limit of first class interval.
Coefficient of Range
The relative measure of range is called the coefficient of
range.
Co efficient of Range = (L-S) / (L+S)
Example 6.2
The following data relates to the heights of 10 students (in
cms) in a school.
Calculate the range and coefficient of range.
158, 164, 168, 170, 142, 160, 154, 174, 159, 146
Solution:
L=142 S=174
Range = L – S = 174 – 142 = 32
Coefficient of range = (L-S)( L+S)
=(174-142)/(174+142) = 32/316 = 0.101
Example 6.3
Calculate
the range and the co-efficient of range for the marks obtained by 100 students
in a school.
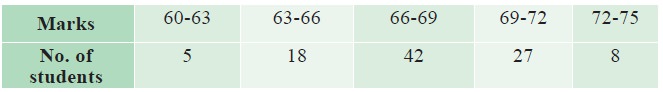
Solution:
L = Upper limit of highest class
= 75
S = lower limit of lowest class = 60
Range = L-S = 75-60 = 15
Coefficient of range = (L-S)( L+S)
=15/(75+60) = 0.111
Merits:
·
Range is the simplest measure of dispersion.
·
It is well defined, and easy to compute.
·
It is widely used in quality control, weather forecasting, stock
market variations etc.
Limitations:
·
The calculations of range is based on only two values – largest
value and smallest value.
·
It is largely influenced by two extreme value.
·
It cannot be computed in the case of open-ended frequency
distributions.
·
It is not suitable for further mathematical treatment.
2. Inter Quartile Range and Quartile Deviation
The quartiles Q1, Q2 and Q3
have been introduced and studied in Chapter 5.
Inter quartile range is defined as: Inter quartile Range (IQR) =
Q3-Q1
Quartile Deviation is defined as, half of the distance between Q1
and Q3.
Quartile Deviation Q.D = Q3-Q1 / 2
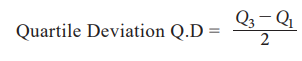
It is also called as semi-inter quartile range.
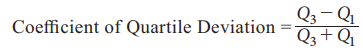
Coefficient of Quartile Deviation
The
relative measure corresponding to QD is coefficient of QD and is defined as:
Coefficient
of Quartile Deviation = Q3-Q1 / Q3+Q1
Merits:
·
It is not affected by the extreme (highest and lowest) values in
the data set.
·
It is an appropriate measure of variation for a data set
summarized in open-ended class intervals.
·
It is a positional measure of variation; therefore it is useful
in the cases of erratic or highly skewed distributions.
Limitations:
·
The QD is based on the middle 50 per cent observed values only
and is not based on all the observations in the data set, therefore it cannot
be considered as a good measure of variation.
·
It is not suitable for mathematical treatment.
·
It
is affected by sampling fluctuations.
·
The QD is a positional measure and has no relationship with any
average in the data set.
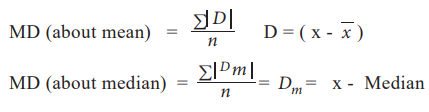
3. Mean Deviation
The Mean Deviation (MD) is defined as the arithmetic mean of the
absolute deviations of the individual values from a measure of central tendency
of the data set. It is also known as the average deviation.
The measure of central tendency is either mean or median. If the
measure of central tendency is mean (or median), then we get the mean deviation
about the mean (or median).
The
coefficient of mean deviation (CMD) is the relative measure of dispersion corresponding
to mean deviation and it is given by
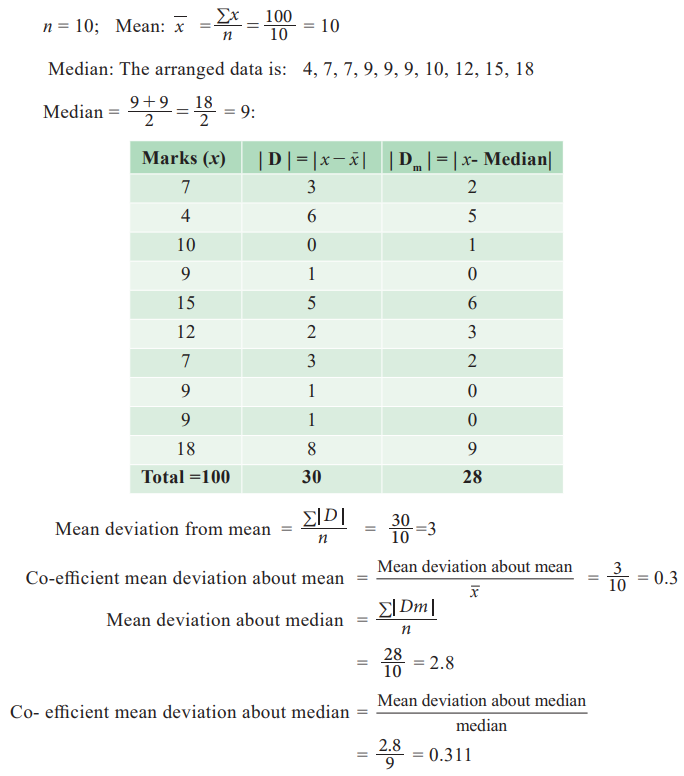
Example 6.4
The following are the weights of 10 children admitted in a
hospital on a particular day.
Find the mean deviation about mean, median and their
coefficients of mean deviation.
7,4,10,9,15,12,7,9,9,18
Solution:
4. Standard Deviation
Consider the following data sets.
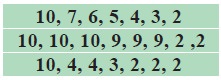
It is obvious that the range for the three sets of data is 8.
But a careful look at these sets clearly shows the numbers are different and there is a necessity for a new measure to address the real
variations among the numbers in the three data sets. This variation is measured
by standard deviation. The idea of standard deviation was given by Karl Pearson
in 1893.
Definition
‘Standard deviation is the positive square
root of average of the deviations of all the observation taken from the mean.’
It is denoted by a greek letter v.
a. Ungrouped data
x1 , x2 ,
x3 ...
xn are the ungrouped data then standard deviation is calculated
by
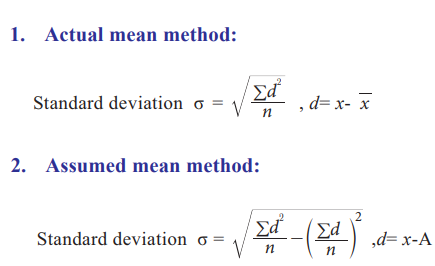
b. Grouped Data (Discrete)
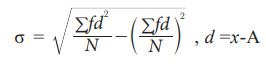
Where, f = frequency of each class interval
N = total number of observation
(or elements) in the population
x = mid – value of each
class interval
where A is an assumed
A.M.
c. Grouped Data (continuous)
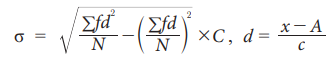
Where, f = frequency
of each class interval
N = total number of
observation (or elements) in the population
c = width of class
interval
x
= mid-value of each
class interval where A is an assumed
A.M.
Variance : Sum of the squares of
the deviation from mean is known as Variance.
The square root of the variance is known as standard deviation.
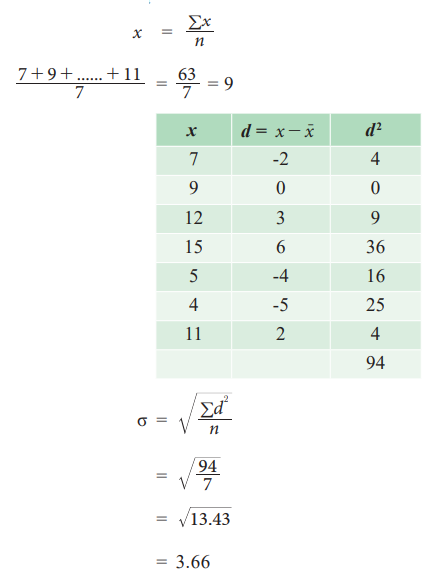
Example 6.5
The following data gives the number of books taken in a school
library in 7 days find the standard deviation of the book taken
7, 9, 12, 15, 5, 4, 11
Solution:
Actual mean method
Merits:
·
The value of standard deviation is based on every observation in
a set of data.
·
It is less affected by fluctuations of sampling.
·
It is the only measure of variation capable of algebraic
treatment.
Limitations:
·
Compared to other measures of dispersion, calculations of
standard deviation are difficult.
·
While calculating standard deviation, more weight is given to
extreme values and less to those near mean.
·
It cannot be calculated in open intervals.
· If two or more data set were given in different units, variation among those data set cannot be compared.
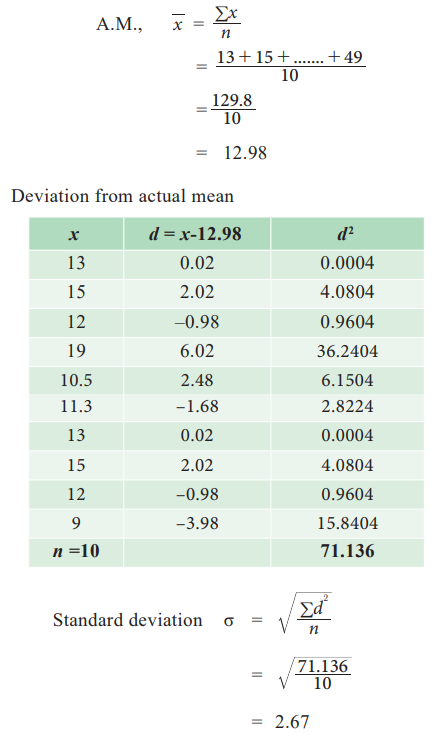
Example 6.6
Raw Data:
Weights of children admitted in a hospital is given below
calculate the standard deviation of weights of children.
13, 15, 12, 19, 10.5, 11.3, 13, 15, 12, 9
Solution:
Example 6.7
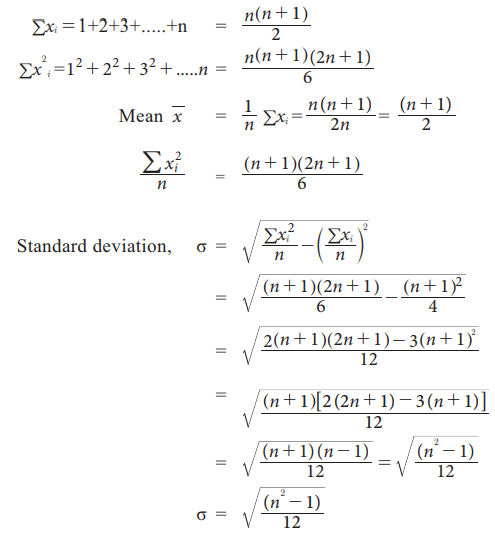
Find the standard deviation of the first ‘n’ natural numbers.
Solution:
The first n natural numbers are 1, 2, 3,…, n. The sum and the sum
of squares of these n numbers are
Example 6.8
The wholesale price of a commodity for seven consecutive days in
a month is as follows:
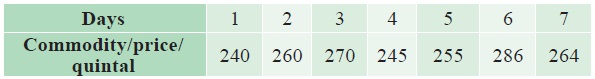
Calculate the variance and standard deviation.
Solution:
The computations for variance and standard deviation is
cumbersome when x values are large.
So, another method is used, which will reduce the calculation time. Here we
take the deviations from an assumed mean or arbitrary value A such that d = x – A
In this question, if we take deviation from an assumed A.M.
=255. The calculations then for standard deviation will be as shown in below
Table;
Example 6.9
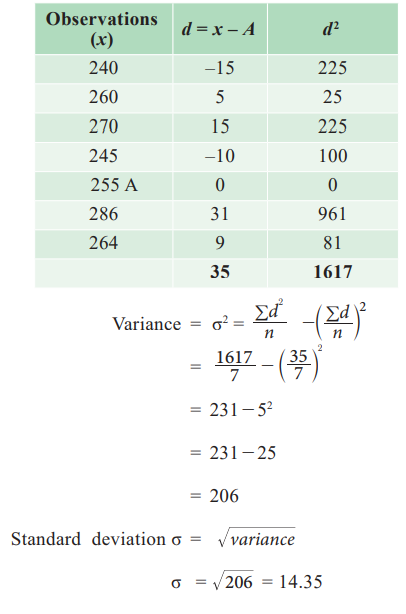
The mean and standard deviation from 18 observations are 14 and
12 respectively. If an additional observation 8 is to be included, find the
corrected mean and standard deviation.
Solution:
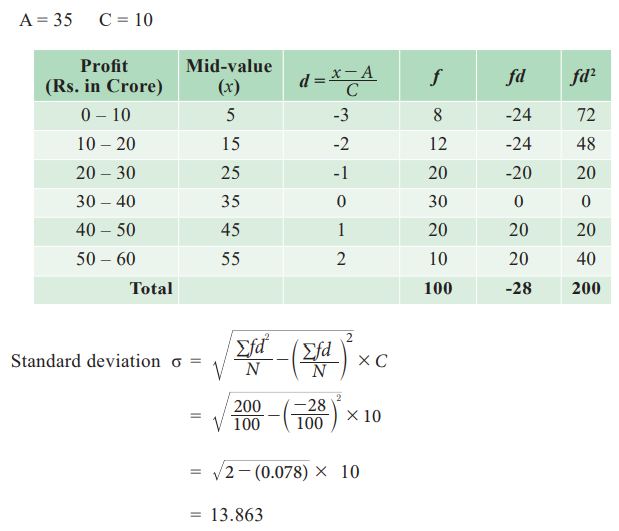
Example 6.10
A study of 100 engineering companies gives the following
information
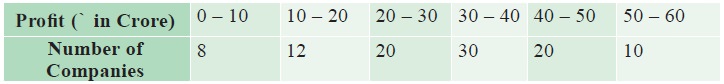
Calculate the standard of the profit earned.
Solution:
Related Topics