Chapter: Organic Chemistry: Organic spectroscopy and analysis
Visible and ultra violet spectroscopy
VISIBLE AND ULTRA VIOLET SPECTROSCOPY
Key Notes
Introduction
Visible/ultra
violet spectroscopy is useful in the analysis of extended con-jugated systems.
Absorption of vis/uv radiation results in the promotion of electrons from low
electronic levels to higher ones.
Electronic transitions
Vis-uv
spectroscopy is useful in the analysis of unsaturated molecules such as
conjugated alkenes and involves the measurement of electronic transi-tions from
the highest occupied molecular orbital to the lowest unoccupied molecular
orbital (π−π*). If a
heteroatom is present in the conjugated system n-π* transitions are possible as well as π−π* transitions.
Measurements
Absorbance
is a measure of the amount of energy absorbed by a sample, having corrected for
any energy absorbed by the solvent. A uv spectrum measures the absorbance (A)
versus the wavelength of energy absorbed. The wavelength at which absorbance is
a maximum for a peak is λmax. The strength of absorption
at λmax is
known as the molar absorptivity (ε) and takes into account the concentration of
the sample and length of the sample cell. Vis-uv spectra can be used to measure
the concentrations of samples.
Structural analysis
The
theoretical value for λmax can be calculated using
tables which quantify the effects of extra conjugation and substituents for a
particular parent sys-tem. This can be compared versus the observed λmax to help
confirm a pro-posed structure or to choose between different possible
structures.
Introduction
Visible/ultra violet spectroscopy is one of the
oldest forms of spectroscopy, but its use in identifying the structure of
organic compounds has waned with the advent of more recent spectroscopic
techniques. Nevertheless, vis-uv spectroscopy can still be a worthwhile tool
for the organic chemist, especially in the structural analysis of organic molecules
which contain extended
conjugated systems. This
typically occurs when functional groups such as alkenes, ketones, aldehydes,
carboxylic acids, esters and aromatic rings are in conjugation with other unsaturated
systems. When electromagnetic radiation in the visible-uv region is absorbed by
a mole- cule, the energy absorbed excites electrons from low electronic levels
to higher ones. For that reason, visible and UV spectra are often called electronic spectra.
Electronic transitions
The easiest transition involves the promotion
of an electron from the highest occupied molecular orbital (HOMO) to the lowest
unoccupied molecular orbital (LUMO). We described the formation of two
molecular orbitals for the hydrogen molecule – a bonding (σ) MO of lower energy and an antibonding (σ∗) MO of higher energy. In a hydrogen molecule
both electrons fill the σ MO resulting in stabilization. An electronic
transition would involve promoting one of the electrons in the σ MO to the σ∗ MO. The energy required for this transition is
too great to be measured in the vis-uv spectrum. This is also true for the σ-bonds present in organic molecules which means that vis-uv
spectroscopy cannot be used to analyze saturated organic molecules.
However, vis-UV spectroscopy is useful in the
analysis of unsaturated com-pounds – compounds that contain π-bonds. When two half filled p orbitals form a π bond, two molecular orbitals are formed – a more stable bonding π MO and a less stable antibonding π* MO (Fig. 1). Both
electrons occupy the bonding π MO and this becomes the HOMO (since it is less
stable than any of the σ-MO’s present in the molecule). The antibonding
π* MO remains unoccupied and becomes the LUMO.
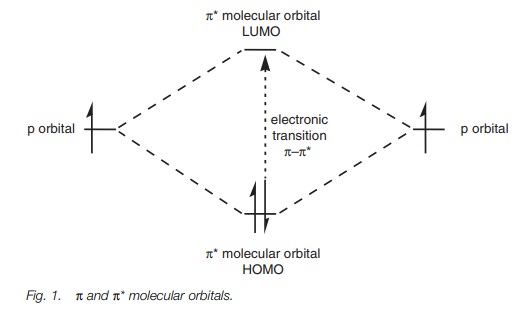
The easiest and least energetic electronic
transition is the promotion of one of the electrons from the π MO to the π* MO. The energy separation between the MO and
the π* MO is less than that between aσ MO and a σ* MO, but for a sim-ple alkene this corresponds
to a wavelength of less than 200 nm which is still too energetic for the vis-uv
spectrum.
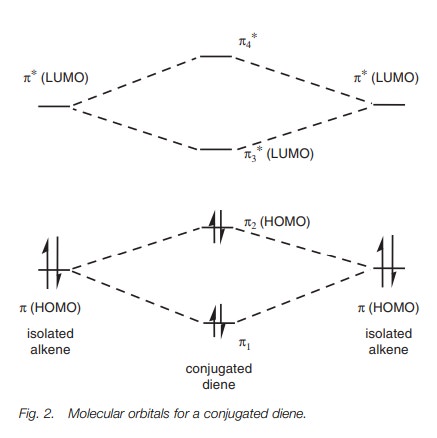
When it comes to conjugated systems, the energy
difference between the HUMO and LUMO is greatly reduced allowing electronic
transitions to occur in the vis-uv region. We saw that it was possible for the
two π-orbitals in conjugated dienes to interact with
each other. This interaction can result in modified molecular orbitals as shown
in Fig. 2. The two π orbitals of the isolated alkenes interact to give two new π orbitals π1 and π2 for the diene. A similar process takes place
with the antibonding orbitals with the result that the energy difference
between the HOMO and LUMO is reduced. For example, the λmax for ethene is 171 nm whereas it is 217 nm for 1,3-butadiene.
(Remember that a higher wavelength means a lower energy.)
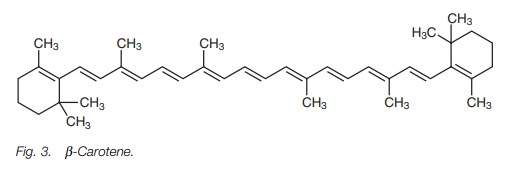
As the amount of conjugation increases, the energy difference between the HOMO and the LUMO decreases until the difference is small enough for transitions to occur in the visible region – resulting in a colored compound.
For example, β-carotene (Fig. 3) is the
precursor for Vitamin A and is responsible for the orange color in carrots. It
has an absorption maximum of 497 nm which corre-sponds to blue-green. Since
this is the light that is absorbed, the color observed is what remains (i.e.
red-orange).
With conjugated dienes, the electronic
transitions are due to π−π* transitions. If a heteroatom such as oxygen
is present (e.g. an unsaturated aldehyde), π−π* tran-sitions are still possible, but it is also possible for one
of the non-bonding electrons (i.e. from a lone pair of electrons) to be
promoted to the LUMO. This transition is known as n–π*. This transition involves less energy than a π−π* transition but the absorption bands observed in the spectrum are
usually weaker in intensity than those due to π−π* transitions.
Measurements
When measuring vis-uv spectra, the light beam
is split such that one half goes through a solution of the sample (the sample
beam) and the other half goes through the solvent alone (the reference beam).
If energy is absorbed by the sample, the intensity of the sample beam (IS)
after it has passed through the sample will be less than the intensity of the
reference beam (IR) after it has passed through the solvent. This is
measured as the absorbance (A)
where:
A = log(IR/IS)
The absorbance will change depending on the
wavelength of light used and so a spectrum is produced measuring wavelength (in
nm) versus absorbance. There may be one or several broad absorption peaks in
the spectrum. The wavelength at which the absorption is a maximum for any of
these peaks is called λmax
and is reported for the compound. The strength of the absorption at this
point is quanti- fied by a term known as the molar absorptivity (ε), which is
related to absorbance (A), the concentration of the sample (C) and the length
(l) in centimeters of the cell containing the sample. The units of ε are M−1cm−1.
A =ε× C × l
Knowing λmax and ε for a particular
compound means that it is possible to mea- sure the concentration of a sample
if the absorbance of a solution is measured at λmax. The ability to
quantify concentrations using vis-uv spectroscopy is important in the analysis
of mixtures using a technique known as high performance liquid chromatography
(hplc). In this procedure, mixtures are passed down a column and exit
the column at
different rates. The
compounds can be
detected and quantified by
passing them through a vis-uv spectrometer as they come off the column.
Structural analysis
The λmax for an absorption related
to a particular electronic transition depends on the extent of conjugation in
the molecule and also the types of substituent which might be present. The
predicted value for λmax can be calculated using tables that quantify
these effects for a particular parent system, e.g. the table for conjugated
dienes is shown in Fig. 4.
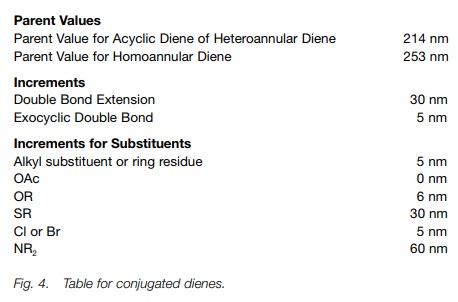
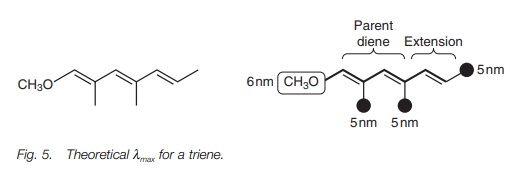
The predicted λmax for the triene in Fig. 5
is calculated as follows. The parent sys-tem is the conjugated diene (214 nm).
There is one extra double bond in conjuga-tion with the diene which means
adding an extra 30 nm for double bond extension. There are also substituents
attached to the triene system – three methyl groups worth 5 nm each, and one
methoxy group worth 6 nm. This gives a predicted λmax of 265 nm.
A comparison of the predicted λmax versus the observed λmax can be used as sup-porting evidence for a
proposed structure. It can also be useful in choosing between two or more
likely structures for a test compound. Separate tables are available for α,β-unsaturated aldehydes and ketones, α,β-unsaturated acids and esters, and benzene derivatives.
Related Topics