Chapter: Medical Physiology: Cardiac Output, Venous Return, and Their Regulation
Pathologically High and Pathologically Low Cardiac Outputs
Pathologically High and Pathologically Low Cardiac Outputs
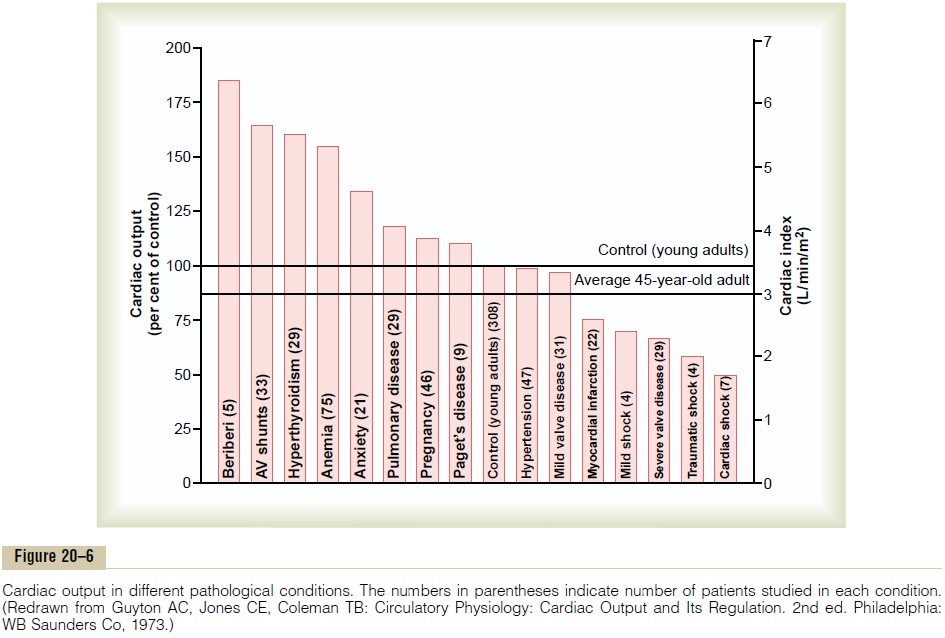
In healthy human beings, the cardiac outputs are surprisingly constant from one person to another. However, multiple clinical abnormalities can cause either high or low cardiac outputs. Some of the more important of these are shown in Figure 20–6.
High Cardiac Output Caused by Reduced Total Peripheral Resistance
The left side of Figure 20–6 identifies conditions that commonly cause cardiac outputs higher than normal. One of the distinguishing features of these conditions is that they all result from chronically reduced total periph-eral resistance. None of them result from excessiveexcitation of the heart itself, which we will explain sub-sequently. For the present, let us look at some of the conditions that can decrease the peripheral resistance and at the same time increase the cardiac output to above normal.
1. Beriberi. This disease is caused by insufficientquantity of the vitamin thiamine (vitamin B1) in the diet. Lack of this vitamin causes diminished ability of the tissues to use some cellular nutrients, and the local tissue blood flow mechanisms in turn cause marked compensatory peripheral vasodilation. Sometimes the total peripheral resistance decreases to as little as one-half normal. Consequently, the long-term levels of venous return and cardiac output also often increase to twice normal.
2. Arteriovenous fistula (shunt). Earlier, we pointedout that whenever a fistula (also called an AV shunt) occurs between a major artery and a major vein, tremendous amounts of blood flow directly from the artery into the vein. This, too, greatly decreases the total peripheral resistance and, likewise, increases the venous return and cardiac output.
3. Hyperthyroidism. In hyperthyroidism, themetabolism of most tissues of the body becomes greatly increased. Oxygen usage increases, and vasodilator products are released from the tissues. Therefore, the total peripheral resistance decreases markedly because of the local tissue blood flow control reactions throughout the body; consequently, the venous return and cardiac output often increase to 40 to 80 per cent above normal.
4. Anemia. In anemia, two peripheral effects greatlydecrease the total peripheral resistance. One of these is reduced viscosity of the blood, resulting from the decreased concentration of red blood
The other is diminished delivery of oxygen to the tissues, which causes local vasodilation. As a consequence, the cardiac output increases greatly. Any other factor that decreases the total peripheral resistance chronically also increases the cardiac output.
Low Cardiac Output
Figure 20–6 shows at the far right several conditions that cause abnormally low cardiac output. These conditions fall into two categories: (1) those abnormalities that cause the pumping effectiveness of the heart to fall too low and (2) those that cause venous return to fall too low.
Decreased Cardiac Output Caused by Cardiac Factors. When-ever the heart becomes severely damaged, regardless of the cause, its limited level of pumping may fall below that needed for adequate blood flow to the tissues. Some examples of this include (1) severe coronary blood vesselblockage and consequent myocardial infarction, (2) severe valvular heart disease, (3) myocarditis, (4) cardiac tamponade, and (5) cardiac metabolic derangements.
The effects of several of these are shown on the right in Figure 20–6, demonstrating the low cardiac outputs that result.
When the cardiac output falls so low that the tissues throughout the body begin to suffer nutritional defi-ciency, the condition is called cardiac shock.
Decrease in Cardiac Output Caused by Non-cardiac Peripheral Factors—Decreased Venous Return. Anything that inter-feres with venous return also can lead to decreased cardiac output. Some of these factors are the following:
1. Decreased blood volume. By far, the mostcommon non-cardiac peripheral factor that leads to decreased cardiac output is decreased blood volume, resulting most often from hemorrhage.
It is clear why this condition decreases the cardiac output: Loss of blood decreases the filling of the vascular system to such a low level that there is not enough blood in the peripheral vessels to create peripheral vascular pressures high enough to push the blood back to the heart.
2. Acute venous dilation. On some occasions, theperipheral veins become acutely vasodilated. This results most often when the sympathetic nervous system suddenly becomes inactive. For instance, fainting often results from sudden loss of sympathetic nervous system activity, which causes the peripheral capacitative vessels, especially the veins, to dilate markedly. This decreases the filling pressure of the vascular system because the blood volume can no longer create adequate pressure in the now flaccid peripheral blood vessels. As a result, the blood “pools” in the vessels and does not return to the heart.
3. Obstruction of the large veins. On rare occasions,the large veins leading into the heart become obstructed, so that the blood in the peripheral vessels cannot flow back into the heart. Consequently, the cardiac output falls markedly.
4. Decreased tissue mass, especially decreased skeletal muscle mass. With normal aging or with prolongedperiods of physical inactivity, there is usually a reduction in the size of the skeletal muscles. This, in turn, decreases the total oxygen consumption and blood flow needs of the muscles, resulting in decreases in skeletal muscle blood flow and cardiac output.
Regardless of the cause of low cardiac output, whether it be a peripheral factor or a cardiac factor, if ever the cardiac output falls below that level required for adequate nutrition of the tissues, the person is said to suffer circulatory shock. This condition can be lethal within a few minutes to a few hours. Circulatory shock is such an important clinical problem.
A More Quantitative Analysis of Cardiac Output Regulation
Our discussion of cardiac output regulation thus far is adequate for understanding the factors that control cardiac output in most simple conditions. However, to understand cardiac output regulation in especially stressful situations, such as the extremes of exercise, cardiac failure, and circulatory shock, a more complex quantitative analysis is presented in the following sections.
To perform the more quantitative analysis, it is nec-essary to distinguish separately the two primary factors concerned with cardiac output regulation: (1) the pumping ability of the heart, as represented bycardiacoutput curves, and (2) the peripheral factors that affectflow of blood from the veins into the heart, as repre-sented by venous return curves. Then one can put these curves together in a quantitative way to show how they interact with each other to determine cardiac output, venous return, and right atrial pressure at the same time.
Cardiac Output Curves Used in the Quantitative Analysis
Some of the cardiac output curves used to depict quan-titative heart pumping effectiveness have already been shown in Figure 20–4. However, an additional set of curves is required to show the effect on cardiac output caused by changing external pressures on the outside of the heart.
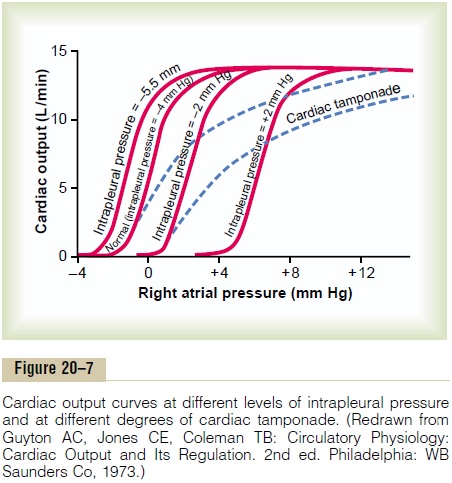
Effect of External Pressure Outside the Heart on Cardiac Output Curves. Figure 20–7 shows the effect of changes in exter-nal cardiac pressure on the cardiac output curve. The normal external pressure is equal to the normal intrapleural pressure (the pressure in the chest cavity), which is -4 mm Hg. Note in the figure that a rise in intrapleural pressure, to -2 mm Hg, shifts the entire cardiac output curve to the right by the same amount. This shift occurs because to fill the cardiac chambers with blood requires an extra 2 mm Hg right atrial pres-sure to overcome the increased pressure on the outside of the heart. Likewise, an increase in intrapleural pres-sure to +2 mm Hg requires a 6 mm Hg increase in right atrial pressure from the normal -4 mm Hg, which shifts the entire cardiac output curve 6 mm Hg to the right.
Some of the factors that can alter the intrapleural pressure and thereby shift the cardiac output curve are the following:
1. Cyclical changes of intrapleural pressure during respiration, which are about±2 mm Hg duringnormal breathing but can be as much as ±50 mm Hg during strenuous breathing.
2. Breathing against a negative pressure, which shiftsthe curve to a more negative right atrial pressure (to the left).
3. Positive pressure breathing, which shifts the curve tothe right.
4. Opening the thoracic cage, which increases theintrapleural pressure to 0 mm Hg and shifts the cardiac output curve to the right 4 mm Hg.
5. Cardiac tamponade, which means accumulation ofa large quantity of fluid in the pericardial cavity around the heart with resultant increase in external cardiac pressure and shifting of the curve to the right. Note in Figure 20–7 that cardiac tamponade shifts the upper parts of the curves farther to the right than the lower parts because the external “tamponade” pressure rises to higher values as the chambers of the heart fill to increased volumes during high cardiac output.
Combinations of Different Patterns of Cardiac Output Curves.
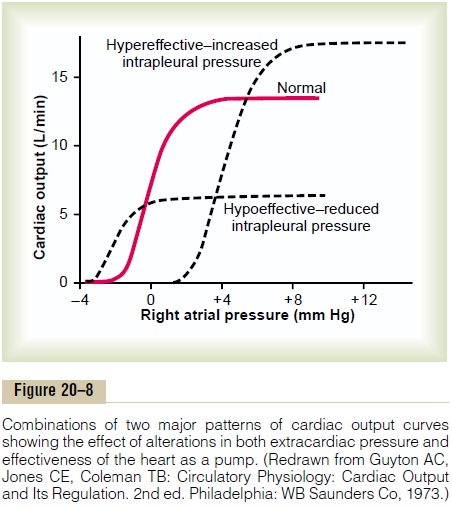
Figure 20–8 shows that the final cardiac output curve can change as a result of simultaneous changes in (a) exter-nal cardiac pressure and (b) effectiveness of the heart as a pump. Thus, by knowing what is happening to the external pressure as well as to the capability of the heart as a pump, one can express the momentary ability of the heart to pump blood by a single cardiac output curve.
Venous Return Curves
There remains the entire systemic circulation that must be considered before total analysis of cardiac regulation can be achieved. To analyze the function of the systemic circulation, we first remove the heart and lungs from the circulation of an animal and replace them with a pump and artificial oxygenator system. Then, different factors, such blood volume, vascular resistances, and central venous pressure in the right atrium, are altered to determine how the systemic circulation operates in different circulatory states. In these studies, one finds three principal factors that affect venous return to the heart from the systemic circulation. They are as follows:
1. Right atrial pressure, which exerts a backward forceon the veins to impede flow of blood from the veins into the right atrium.
2. Degree of filling of the systemic circulation (measured by the mean systemic filling pressure), which forces the systemic blood toward the heart (this is the pressure measured everywhere in the systemic circulation when all flow of blood is stopped—we discuss this in detail later).
3. Resistance to blood flow between the peripheralvessels and the right atrium.
These factors can all be expressed quantitatively by the venous return curve, as we explain in the next sections.
Normal Venous Return Curve
In the same way that the cardiac output curve relates pumping of blood by the heart to right atrial pressure, the venous return curve relates venous return also toright atrial pressure—that is, the venousflow of bloodinto the heart from the systemic circulation at different levels of right atrial pressure.
The curve in Figure 20–9 is the normal venous return curve. This curve shows that when heart pumping capa-bility becomes diminished and causes the right atrial pressure to rise, the backward force of the rising atrial pressure on the veins of the systemic circulation decreases venous return of blood to the heart. If allnervous circulatory reflexes are prevented from acting,venous return decreases to zero when the right atrial pressure rises to about +7 mm Hg. Such a slight rise in right atrial pressure causes a drastic decrease in venous return because the systemic circulation is a distensible bag, so that any increase in back pressure causes blood to dam up in this bag instead of returning to the heart.
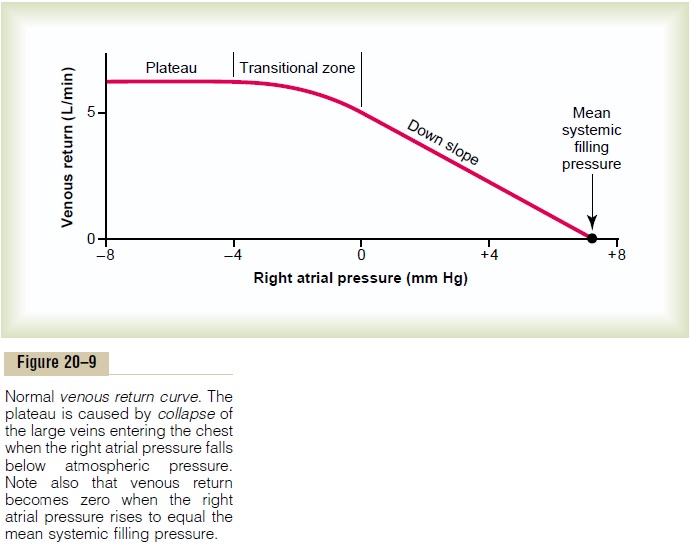
At the same time that the right atrial pressure is rising and causing venous stasis, pumping by the heart also approaches zero because of decreasing venous return. Both the arterial and the venous pressures come to equilibrium when all flow in the systemic circulation ceases at a pressure of 7 mm Hg, which, by definition, is the mean systemic filling pressure (Psf).
Plateau in the Venous Return Curve at Negative Atrial Pressures—Caused by Collapse of the Large Veins. When theright atrial pressure falls below zero—that is, below atmospheric pressure—further increase in venous return almost ceases. And by the time the right atrial pressure has fallen to about -2 mm Hg, the venous return will have reached a plateau. It remains at this plateau level even though the right atrial pressure falls to -20 mm Hg, -50 mm Hg, or even further. This plateau is caused by collapse of the veins entering the chest. Neg-ative pressure in the right atrium sucks the walls of the veins together where they enter the chest, which pre-vents any additional flow of blood from the peripheral veins. Consequently, even very negative pressures in the right atrium cannot increase venous return significantly above that which exists at a normal atrial pressure of 0 mm Hg.
Mean Circulatory Filling Pressure and Mean Systemic Filling Pressure, and Their Effect on Venous Return
When heart pumping is stopped by shocking the heart with electricity to cause ventricular fibrillation or is stopped in any other way, flow of blood everywhere in the circulation ceases a few seconds later. Without blood flow, the pressures everywhere in the circulation become equal. This equilibrated pressure level is called the mean circulatory filling pressure.
Effect of Blood Volume on Mean Circulatory Filling Pressure.
The greater the volume of blood in the circulation, the greater is the mean circulatory filling pressure because extra blood volume stretches the walls of the vascula-ture. The red curve in Figure 20–10 shows the approxi-mate normal effect of different levels of blood volume on the mean circulatory filling pressure. Note that at a blood volume of about 4000 milliliters, the mean circu-latory filling pressure is close to zero because this is the “unstressed volume” of the circulation, but at a volume of 5000 milliliters, the filling pressure is the normal value of 7 mm Hg. Similarly, at still higher volumes, the mean circulatory filling pressure increases almost linearly.
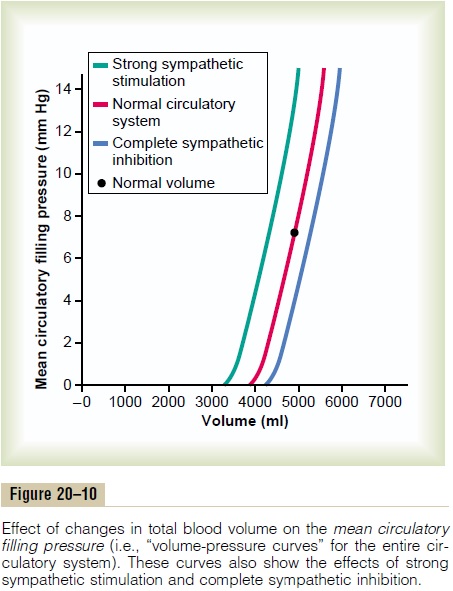
Effect of Sympathetic Nervous Stimulation of the Circulation on Mean Circulatory Filling Pressure. Thegreen curveandbluecurve in Figure 20–10 show the effects, respectively,of high and low levels of sympathetic nervous activity on the mean circulatory filling pressure. Strong sympa-thetic stimulation constricts all the systemic blood vessels as well as the larger pulmonary blood vessels and even the chambers of the heart. Therefore, the capacity of the system decreases, so that at each level of blood volume, the mean circulatory filling pressure is increased. At normal blood volume, maximal sympa-thetic stimulation increases the mean circulatory filling pressure from 7 mm Hg to about 2.5 times that value, or about 17 mm Hg.
Conversely, complete inhibition of the sympathetic nervous system relaxes both the blood vessels and the heart, decreasing the mean circulatory filling pressure from the normal value of 7 mm Hg down to about 4 mm Hg. Before leaving Figure 20–10, note specifically how steep the curves are. This means that even slight changes in blood volume or slight changes in the capacity of the system caused by various levels of sympathetic activity can have large effects on the mean circulatory filling pressure.
Mean Systemic Filling Pressure and Its Relation to Mean Circula- tory Filling Pressure. Themean systemic filling pressure,Psf, is slightly different from the mean circulatory filling pressure. It is the pressure measured everywhere in thesystemic circulation after bloodflow has been stoppedby clamping the large blood vessels at the heart, so that the pressures in the systemic circulation can be meas-ured independently from those in the pulmonary circu-lation. The mean systemic pressure, although almost impossible to measure in the living animal, is the impor-tant pressure for determining venous return. The meansystemic filling pressure, however, is almost always nearly equal to the mean circulatory filling pressure because thepulmonary circulation has less than one eighth as much capacitance as the systemic circulation and only about one tenth as much blood volume.
Effect on the Venous Return Curve of Changes in Mean Systemic Filling Pressure. Figure 20–11 shows the effects on thevenous return curve caused by increasing or decreasing the mean systemic filling pressure (Psf). Note in Figure 20–11 that the normal mean systemic filling pressure is 7 mm Hg. Then, for the uppermost curve in the figure, the mean systemic filling pressure has been increased to 14 mm Hg, and for the lowermost curve, has been decreased to 3.5 mm Hg. These curves demonstrate that the greater the mean systemic filling pressure (which also means the greater the “tightness” with which the circulatory system is filled with blood) the more the venous return curve shifts upward and to the right.
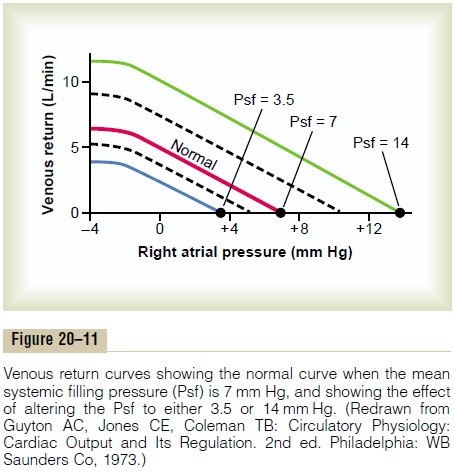
Conversely, the lower the mean systemic filling pressure, the more the curve shifts downward and to the left.
To express this another way, the greater the system is filled, the easier it is for blood to flow into the heart. The less the filling, the more difficult it is for blood to flow into the heart.
“Pressure Gradient for Venous Return”—When This Is Zero, There Is No Venous Return. When the right atrial pressure risesto equal the mean systemic filling pressure, there is no longer any pressure difference between the peripheral vessels and the right atrium. Consequently, there can no longer be any blood flow from any peripheral vessels back to the right atrium. However, when the right atrial pressure falls progressively lower than the mean sys-temic filling pressure, the flow to the heart increases proportionately, as one can see by studying any of the venous return curves in Figure 20–11. That is, the greaterthe difference between the mean systemic filling pressure and the right atrial pressure, the greater becomes the venous return. Therefore, the difference between thesetwo pressures is called the pressure gradient for venousreturn.
Resistance to Venous Return
In the same way that mean systemic filling pressure rep-resents a pressure pushing venous blood from the periphery toward the heart, there is also resistance to this venous flow of blood. It is called theresistance tovenous return. Most of the resistance to venous returnoccurs in the veins, although some occurs in the arteri-oles and small arteries as well.
Why is venous resistance so important in determin-ing the resistance to venous return? The answer is that when the resistance in the veins increases, blood begins to be dammed up, mainly in the veins themselves. But the venous pressure rises very little because the veins are highly distensible. Therefore, this rise in venous pressure is not very effective in overcoming the resist-ance, and blood flow into the right atrium decreases drastically. Conversely, when arteriolar and small artery resistances increase, blood accumulates in the arteries, which have a capacitance only 1/30 as great as that of the veins. Therefore, even slight accumulation of blood in the arteries raises the pressure greatly—30 times as much as in the veins—and this high pressure does over-come much of the increased resistance. Mathematically, it turns out that about two thirds of the so-called “resist-ance to venous return” is determined by venous resist-ance, and about one third by the arteriolar and small artery resistance.
Venous return can be calculated by the following formula:

in which VR is venous return, Psf is mean systemic filling pressure, PRA is right atrial pressure, and RVR is resistance to venous return. In the healthy human adult, the values for these are as follows: venous return equals 5 L/min, mean systemic filling pressure equals 7 mm Hg, right atrial pressure equals 0 mm Hg, and resistance to venous return equals 1.4 mm Hg per liter of blood flow.
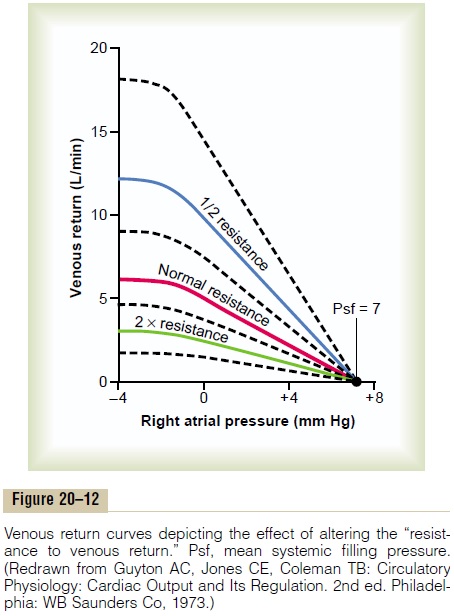
Effect of Resistance to Venous Return on the Venous Return
Curve. Figure 20–12 demonstrates the effect of differentlevels of resistance to venous return on the venous return curve, showing that a decrease in this resistance to one-half normal allows twice as much flow of blood and, therefore, rotates the curve upward to twice as great a slope. Conversely, an increase in resistance to twice normal rotates the curve downward to one-half as great a slope.
Note also that when the right atrial pressure rises to equal the mean systemic filling pressure, venous return becomes zero at all levels of resistance to venous return because when there is no pressure gradient to cause flow of blood, it makes no difference what the resistance is in the circulation; the flow is still zero. Therefore, thehighest level to which the right atrial pressure can rise,regardless of how much the heart might fail, is equal to the mean systemic filling pressure.
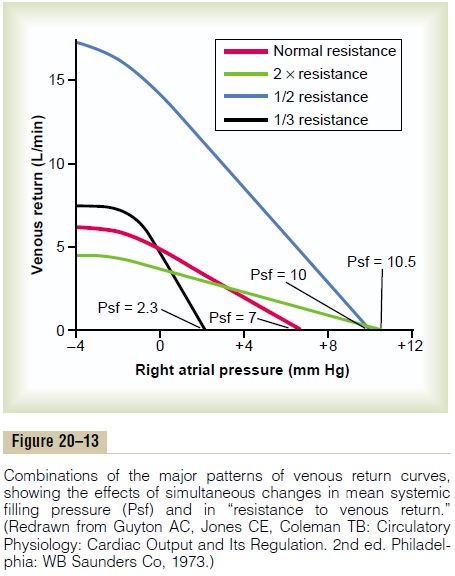
Combinations of Venous Return Curve Patterns. Figure 20–13shows effects on the venous return curve caused by simultaneous changes in mean systemic pressure (Psf) and resistance to venous return, demonstrating that both these factors can operate simultaneously.
Analysis of Cardiac Output and Right Atrial Pressure, Using Simultaneous Cardiac Output and Venous Return Curves
In the complete circulation, the heart and the systemic circulation must operate together. This means that (1) the venous return from the systemic circulation must equal the cardiac output from the heart and (2) the right atrial pressure is the same for both the heart and the systemic circulation.
Therefore, one can predict the cardiac output and right atrial pressure in the following way: (1) Determine the momentary pumping ability of the heart and depict this in the form of a cardiac output curve; (2) determine the momentary state of flow from the systemic circula-tion into the heart and depict this in the form of a venous return curve; and (3) “equate” these curves against each other, as shown in Figure 20–14.
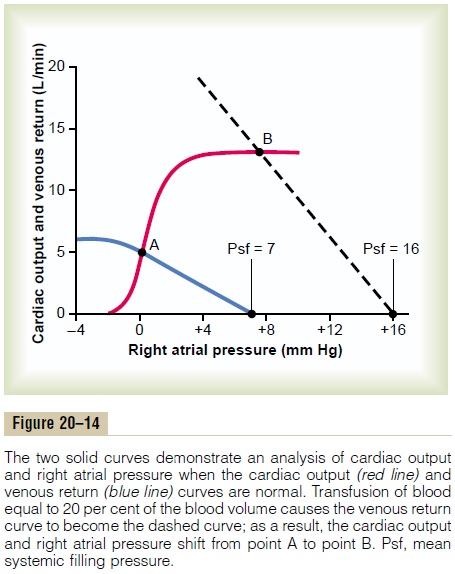
Two curves in the figure depict the normal cardiacoutput curve (red line) and the normal venous return curve (blue line). There is only one point on the graph,point A, at which the venous return equals the cardiac output and at which the right atrial pressure is the same for both the heart and the systemic circulation. There-fore, in the normal circulation, the right atrial pressure, cardiac output, and venous return are all depicted by point A, called the equilibrium point, giving a normal value for cardiac output of 5 liters per minute and a right atrial pressure of 0 mm Hg .
Effect of Increased Blood Volume on Cardiac Output. A suddenincrease in blood volume of about 20 per cent increases the cardiac output to about 2.5 to 3 times normal. An analysis of this effect is shown in Figure 20–14. Imme-diately on infusing the large quantity of extra blood, the increased filling of the system causes the mean systemic filling pressure (Psf) to increase to 16 mm Hg, which shifts the venous return curve to the right. At the same time, the increased blood volume distends the blood vessels, thus reducing their resistance and thereby reducing the resistance to venous return, which rotates the curve upward. As a result of these two effects, the venous return curve of Figure 20–14 is shifted to the right. This new curve equates with the cardiac output curve at point B, showing that the cardiac output and venous return increase 2.5 to 3 times, and that the right atrial pressure rises to about +8 mm Hg.
Further Compensatory Effects Initiated in Response to Increased Blood Volume. The greatly increased cardiac outputcaused by increased blood volume lasts for only a few minutes because several compensatory effects immedi-ately begin to occur: (1) The increased cardiac output increases the capillary pressure so thatfluid begins totransude out of the capillaries into the tissues, thereby returning the blood volume toward normal. (2) The increased pressure in the veins causes the veins to continue distending gradually by the mechanism called stress-relaxation, especially causing the venous bloodreservoirs, such as the liver and spleen, to distend, thus reducing the mean systemic pressure. (3) The excessblood flow through the peripheral tissues causes autoregulatory increase in the peripheral resistance, thus increasing the resistance to venous return. These factors cause the mean systemic filling pressure to return back toward normal and the resistance vessels of the systemic circulation to constrict. Therefore, gradu-ally, over a period of 10 to 40 minutes, the cardiac output returns almost to normal.
Effect of Sympathetic Stimulation on Cardiac Output. Sympa-thetic stimulation affects both the heart and the sys-temic circulation: (1) It makes the heart a stronger pump. (2) In the systemic circulation, itincreases the meansystemic filling pressure because of contraction ofthe peripheral vessels—especially the veins—and it increases the resistance to venous return.
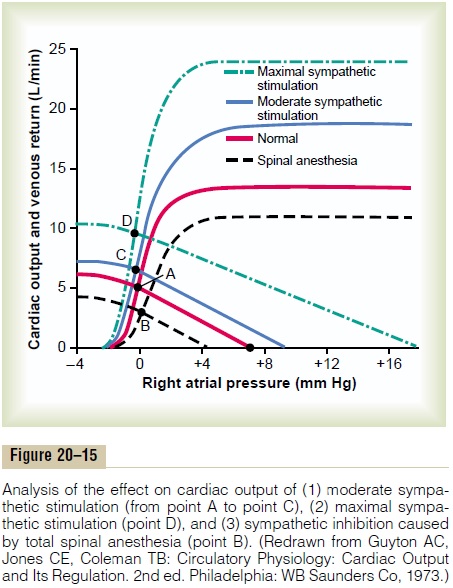
In Figure 20–15, the normal cardiac output and venous return curves are depicted; these equate with each other at point A, which represents a normal venous return and cardiac output of 5 L/min and a right atrial pressure of 0 min Hg. Note in the figure that maximal sympathetic stimulation (green curves) increases the mean systemic filling pressure to 17 mm Hg (depicted by the point at which the venous return curve reaches the zero venous return level). And the sympathetic stim-ulation also increases pumping effectiveness of the heart by nearly 100 per cent. As a result, the cardiac output rises from the normal value at equilibrium point A to about double normal at equilibrium point D—and yet the right atrial pressure hardly changes. Thus, differ-ent degrees of sympathetic stimulation can increase the cardiac output progressively to about twice normal forshort periods of time, until other compensatory effectsoccur within seconds or minutes.
Effect of Sympathetic Inhibition on Cardiac Output. The sym-pathetic nervous system can be blocked by inducing total spinal anesthesia or by using some drug, such as hexamethonium, that blocks transmission of nervesignals through the autonomic ganglia. The lowermost curves in Figure 20–15 show the effect of sympathetic inhibition caused by total spinal anesthesia, demon-strating that (1) the mean systemic filling pressure fallsto about 4 mm Hg and (2) the effectiveness of the heart as a pump decreases to about 80 per cent of normal. Thecardiac output falls from point A to point B, which is a decrease to about 60 per cent of normal.
Effect of Opening a Large Arteriovenous Fistula. Figure 20–16shows various stages of circulatory changes that occur after opening a large arteriovenous fistula, that is, after making an opening directly between a large artery and a large vein.
1.The two red curves crossing at point A show the normal condition.
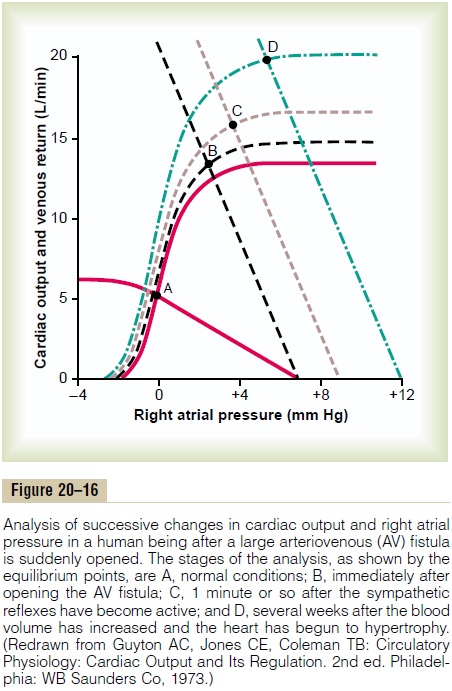
2.The curves crossing at point B show the circulatory condition immediately after opening the largefistula. The principal effects are (1) a sudden andprecipitous rotation of the venous return curve upward caused by the large decrease in resistance tovenous return when blood is allowed toflow withalmost no impediment directly from the large arteries into the venous system, bypassing most of the resistance elements of the peripheral circulation, and (2) a slight increase in the level ofthe cardiac output curve because opening thefistuladecreases the peripheral resistance and allows an acute fall in arterial pressure against which the heart can pump more easily. The net result, depicted by point B, is an increase in cardiac outputfrom 5 L/min up to 13 L/min and an increase in right atrial pressure to about +3 mm Hg.
3. Point C represents the effects about 1 minute later, after the sympathetic nerve reflexes have restored the arterial pressure almost to normal and caused two other effects: (1) an increase in the mean systemic filling pressure (because of constriction of all veins and arteries) from 7 to 9 mm Hg, thus shifting the venous return curve 2 mm Hg to the right, and (2) further elevation of the cardiac output curve because of sympathetic nervous excitation of the heart. The cardiac output now rises to almost 16 L/min, and the right atrial pressure to about 4 mm Hg.
4. Point D shows the effect after several more weeks. By this time, the blood volume has increased because the slight reduction in arterial pressure and the sympathetic stimulation have both reduced kidney output of urine. The mean systemic filling pressure has now risen to +12 mm Hg, shifting the venous return curve another 3 mm Hg to the right. Also, the prolonged increased workload on the heart has caused the heart muscle to hypertrophy slightly, raising the level of the cardiac output curve still further. Therefore, point D shows a cardiac output now of almost 20 L/min and a right atrial pressure of about 6 mm Hg.
Other Analyses of Cardiac Output Regulation. Analysis of cardiac output regulation during exercise is presented, and analyses of cardiac output regulation at various stages of congestive heart failure are shown.
Related Topics