Chapter: Clinical Anesthesiology: Anesthetic Equipment & Monitors : Cardiovascular Monitoring
Cardiac Output
CARDIAC OUTPUT
Indications
CO measurement to permit calculation of
the SV is one of the primary reasons for PA catheterization. Currently, there
are a number of alternative, less invasive methods to estimate ventricular
function to assist in goal-directed therapy.
Techniques & Complications
A. Thermodilution
The injection of a quantity (2.5, 5, or
10 mL) of fluid that is below body temperature (usually room tem-perature or
iced) into the right atrium changes the temperature of blood in contact with
the thermistor at the tip of the PA catheter. The degree of change is inversely
proportionate to CO: Temperature change is minimal if there is a high blood
flow, whereas tem-perature change is greater when flow is reduced. After
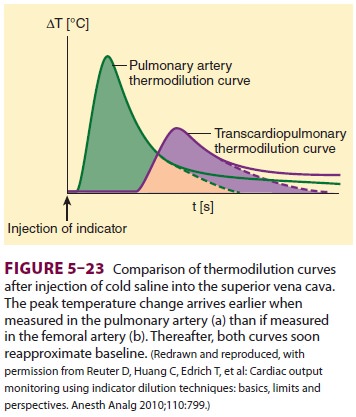
injection, one can plot the temperature as a function of time to produce a thermodilution curve (Figure 5–23).
CO is determined by a computer program that integrates the area under the
curve.Accurate measurements of CO depend on rapid and smooth injection,
precisely knowninjectant temperature and volume, correct entry of the
calibration factors for the specific type of PA catheter into the CO computer,
and avoidance of measurements during electrocautery. Tricuspid regurgitation
and cardiac shunts invalidate results because only right ventricular output
into the PA is actually being measured. Rapid infusion of the iced injectant
has rarely resulted in cardiac arrhythmias.
A modification of the thermodilution
technique allows continuous CO measurement with a special catheter and monitor
system. The catheter contains a thermal filament that introduces small pulses
of heat into the blood proximal to the pulmonic valve and a thermistor that
measures changes in PA blood temperature. A computer in the monitor determines
CO by cross-correlating the amount of heat input with the changes in blood
temperature.
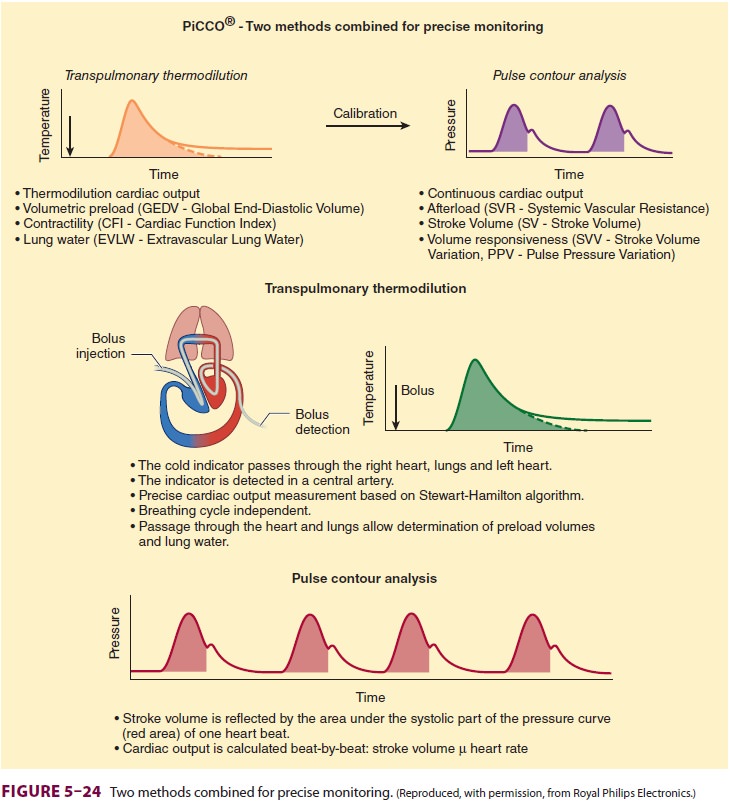
Transpulmonary thermodilution (PiCCO ® sys-tem) relies upon the same
principles of thermodi-lution, but does not require PA catheterization. A
central line and a thermistor-equipped arterial cath-eter (usually placed in
the femoral artery) are nec-essary to perform transpulmonary thermodilution.
Thermal measurements from radial artery catheters have been found to be
invalid. Transpulmonary thermodilution measurements involve injection of cold
indicator into the superior vena cava via a central line ( Figure 5–24). A thermistor notes
the change in temperature in the arterial system follow-ing the cold
indicator’s transit through the heart and lungs and estimates the CO.
Transpulmonary thermodilution also
per-mits the calculation of both the global-end dia-stolic volume (GEDV) and
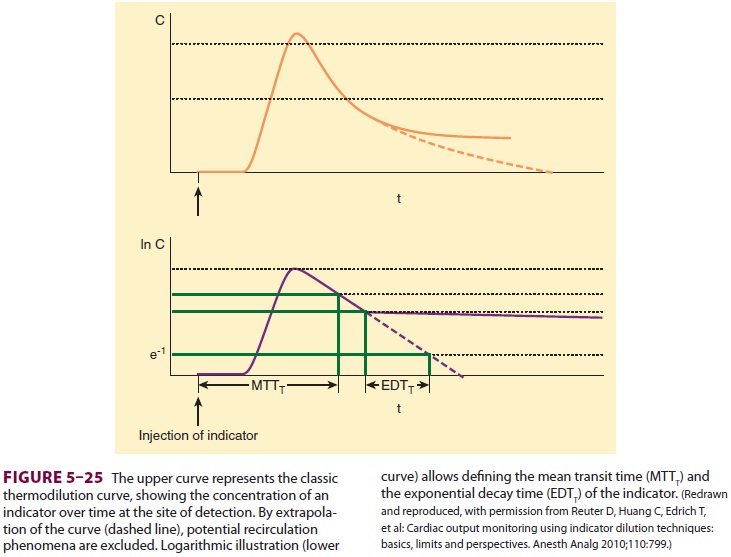
the extravascular lung water (EVLW). Through mathematical analysis and
extrapolation of the thermodilution curve, it is possible for the
transpulmonary thermodilu-tion computer to calculate both the mean transit time
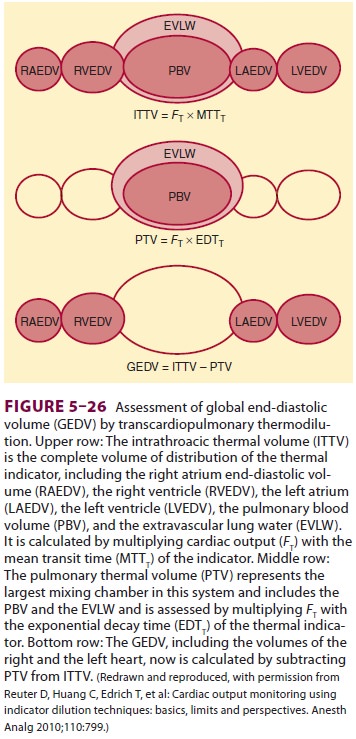
of the indicator and its exponential decay time (Figure 5–25). The intrathoracic
thermal volume (ITTV) is the product of the CO and the mean tran-sit time
(MTT). The ITTV includes the pulmonary blood volume (PBV), EVLW, and the blood
con-tained within the heart. The pulmonary thermal volume (PTV) includes both
the EVLW and the PBV and is obtained by multiplying the CO by the exponential
decay time (EDT). Subtracting the PTV from the ITTV gives the GEDV (Figure 5–26).
The GEDV is a hypothetical volume that assumes that all of the heart’s chambers
are simultaneously full in diastole. With a normal index between 640 and 800
mL/m2, the GEDV can assist in determining
volume status. An extra vascular lung water index of less than 10 mL/kg is
normative. The EVLW is the ITTV
minus the intrathoracic blood volume
(ITBV). The ITBV = GEDV × 1.25.
Th us EVLW = ITTV – ITBV. An increased EVLW can be indicative of fluid overload. Thus, through mathematical analysis of the transpulmonary thermodilution curve, it is possible to obtain volu-metric indices to guide fluid replacement therapy. Moreover, the PiCCO® system calculates SV varia-tion and pulse pressure variation through pulse contour analysis, both of which can be used to determine fluid responsiveness. Both SV and pulse pressure are decreased during positive pressure ven-tilation. The greater the variations over the course of positive pressure inspiration and expiration, the more likely the patient is to improve hemodynamic measures following volume administration.
B. Dye Dilution
If indocyanine green dye (or another indicator such as lithium) is injected through a central venous cath-eter, its appearance in the systemic arterial circula-tion can be measured by analyzing arterial samples with an appropriate detector (eg, a densitometer for indocyanine green). The area under the resulting dye indicator curve is related to CO. By analyzingarterial blood pressure and integrating it with CO, systems that use lithium (LiDCOTM) also calculate beat-to-beat SV. In the LiDCOTM system, a small bolus of lithium chloride is injected into the circu-lation. A lithium-sensitive electrode in an arterial catheter measures the decay in lithium concentra-tion over time. Integrating the concentration over time graph permits the machine to calculate the CO. The LiDCOTM device, like the PiCCO ® ther-modilution device, employs pulse contour analysis of the arterial wave form to provide ongoing beat-to-beat determinations of CO and other calculated parameters. Lithium dilution determinations can be made in patients who have only peripheral venous access. Lithium should not be administered to patients in the first trimester of pregnancy. The dye dilution technique, however, introduces the prob-lems of indicator recirculation, arterial blood sam-pling, and background tracer buildup, potentially limiting the use of such approaches perioperatively. Nondepolarizing neuromuscular blockers may affect the lithium sensor.
C. Pulse Contour Devices
Pulse contour devices use the arterial
pressure tracing to estimate the CO and other dynamicparameters, such as pulse
pressure and SV variation with mechanical ventilation. These indices are used
to help determine if hypotension is likely to respond to fluid therapy.
Pulse contour devices rely upon
algorithms that measure the area of the systolic portion of the arte-rial
pressure trace from end diastole to the end of ventricular ejection. The
devices then incorporate a calibration factor for the patient’s vascular
compli-ance, which is dynamic and not static. Some pulse contour devices rely
first on transpulmonary ther-modilution or lithium thermodilution to calibrate
the machine for subsequent pulse contour measure-ments. The FloTrac (Edwards
Life Sciences) does not require calibration with another measure and relies
upon a statistical analysis of its algorithm to account for changes in vascular
compliance occurring as a consequence of changed vascular tone.
D. Esophageal Doppler
Esophageal Doppler relies upon the
Doppler prin-ciple to measure the velocity of blood flow in the descending
thoracic aorta. The Doppler princi-ple is integral in perioperative
echocardiography, as discussed below. The Doppler effect has been described
previously and is the result of the apparent change in sound frequency when the
source of the sound wave and the observer of the sound wave are in relative
motion. Blood in the aorta is in relative motion compared with the Doppler
probe in the esophagus. As red blood cells travel, they reflect a frequency
shift, depending upon both the direction and velocity of their movement. When
blood flows toward the transducer, its reflected fre-quency is higher than that
which was transmitted by the probe. When blood cells move away from the
transducer, the frequency is lower than that which was initially sent by the
probe. By using the Doppler equation, it is possible to determine the velocity
of blood flow in the aorta. The equation is:
Velocity of blood blow = {frequency
change/ cosine of the angle of incidence between the Doppler beam and the blood
flow} × {speed of sound in tis-sue/2 (source frequency)}
For Doppler to provide a reliable
estimate of velocity, the angle of incidence should be as close to zero as
possible, since the cosine of 0 is 1. As theangle approaches 90°, the Doppler
measure is unre-liable, as the cosine of 90° is 0.
The esophageal Doppler device calculates
the velocity of flow in the aorta. As the velocities of the cells in the aorta
travel at different speeds over the cardiac cycle, the machine obtains a
measure of all of the velocities of the cells moving over time. Mathematically
integrating the velocities represents the distance that the blood travels.
Next, using nor-mograms, the monitor approximates the area of the descending
aorta. The monitor thus calculates both the distance the blood travels, as well
as the area: area × length = volume.
Consequently, the SV of blood in the
descend-ing aorta is calculated. Knowing the HR allows cal-culation of that
portion of the CO flowing through the descending thoracic aorta, which is
approxi-mately 70% of total CO. Correcting for this 30% allows the monitor to
estimate the patient’s total CO. Esophageal Doppler is dependent upon many
assumptions and nomograms, which may hinder its ability to accurately reflect
CO in a variety of clinical situations.
E. Thoracic Bioimpedance
Changes in thoracic volume cause changes
in tho-racic resistance (bioimpedance) to low amplitude, high frequency
currents. If thoracic changes in bioimpedance are measured following
ventricular depolarization, SV can be continuously determined. This noninvasive
technique requires six electrodes to inject microcurrents and to sense
bioimpedance on both sides of the chest. Increasing fluid in the chest results
in less electrical bioimpedance. Mathematical assumptions and correlations are
then made to calculate CO from changes in bioimpedance. Disadvantages of
thoracic bioimpedance include susceptibility to electrical interference and
reliance upon correct electrode positioning. The accuracy of this technique is
questionable in several groups of patients, including those with aortic valve
disease, previous heart surgery, or acute changes in thoracic sympathetic
nervous function (eg, those undergoing spinal anesthesia).
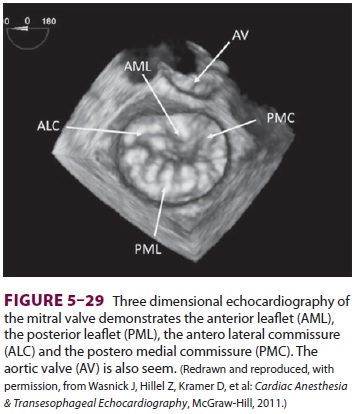
F. Fick Principle
The amount of oxygen consumed by an
individual (Vo2) equals the difference between arterial
and venous (a–v) oxygen content (C) (Cao2
and Cvo2) multiplied by CO. Therefore
Mixed venous and arterial oxygen content
are easily determined if a PA catheter and an arterial line are in place.
Oxygen consumption can also be calculated from the difference between the oxygen
content in inspired and expired gas. Variations of the Fick principle are the
basis of all indicator–dilution methods of determining CO.
G. Echocardiography
Th ere are no more powerful tools to
diagnose and assess cardiac function perioperatively than trans-thoracic
echocardiography (TTE) and transesoph-ageal echocardiography (TEE). Both
approaches are increasingly used in the operative setting. In the operating
rooms, limited access to the chest makes TEE an ideal option to visualize the
heart. Both TTE and TEE can be employed preopera-tively and postoperatively.
TTE has the advantage of being completely noninvasive; however, acquir-ing the
“windows” to view the heart can be difficult. Disposable TEE probes are now
available that can remain in position in critically ill patients for days,
during which intermittent TEE examinations can be performed.
Echocardiography can be employed by
anes-thesia staff in two ways, depending upon degrees of training and
certification. Basic (or hemodynamic) TEE permits the anesthesiologist to
discern the pri-mary source of a patient’s hemodynamic instability. Whereas in
past decades the PA flotation catheter would be used to determine why the
patient might be hypotensive, the anesthetist performing hemody-namic TEE is
attempting to determine if the heart is adequately filled, contracting
appropriately, not externally compressed, and devoid of any grossly obvious
structural defects. At all times, information obtained from hemodynamic TEE may
be corre-lated with other information as to the patient’s gen-eral condition.
Anesthesiologists performing advanced
TEE make therapeutic and surgical recommendations based upon their TEE
interpretations. Various organizations and boards have been established
worldwide to certify individuals in all levels of peri-operative
echocardiography. More importantly, individuals who perform echocardiography
should be aware of the credentialing requirements of their respective
institutions.
Echocardiography has many uses,
including:
·
Diagnosis
of the source of hemodynamic instability, including myocardial ischemia,
systolic and diastolic heart failure, valvular abnormalities, hypovolemia, and
pericardial tamponade
·
Estimation
of hemodynamic parameters, such as SV, CO, and intracavitary pressures
·
Diagnosis
of structural diseases of the heart, such as valvular heart disease, shunts,
aortic diseases
·
Guiding
surgical interventions, such as mitral valve repair.
Various echocardiographic modalities are
employed perioperatively by anesthesiologists, including TTE, TEE, epiaortic
and epicardiac ultra-sound, and three-dimensional echocardiography. Some
advantages and disadvantages of the modali-ties are as follows:
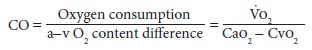
TTE has the advantage of being
noninvasive and essentially risk free. Limited scope TTE exams are now
increasingly common in the intensive care unit (Figure 5–27).
two-dimensional image planes and windows
to mentally recreate the three-dimensional anatomy. The ability to interpret
these images at the advanced certification level requires much training.
Epiaortic and epicardiac ultrasound
imaging techniques employ an echo probe wrapped in a sterile sheath and
manipulated by thoracic surgeons intraoperatively to obtain views of the aorta
and the heart. The air-filled trachea prevents TEE imaging of the ascending
aorta. Because the aorta is manipulated during cardiac surgery, detection of
atherosclerotic plaques permits the surgeon to potentially minimize the
incidence of embolic stroke. Imaging of the heart with epicardial ultrasound
permits intraoperative echocardiography when TEE is contraindicated because of
esophageal or gastric pathology.
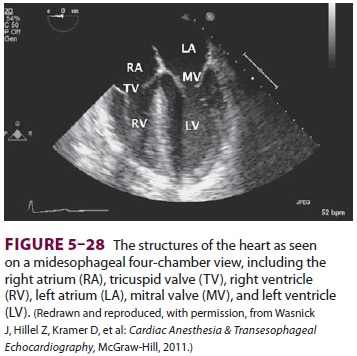
Three-dimensional echocardiography (TTE
and TEE) has become available in recent years (Figure 5–29). These techniques
provide a three-dimensional view of the heart’s structure. In particular, three-dimensional
images can better quantify the heart’s volumes and can generate a surgeon’s
view of the mitral valve to aid in guiding valve repair.
Echocardiography employs ultrasound
(sound at frequencies greater than normal hearing) from 2 to 10 MHz. A
piezoelectrode in the probe trans-ducer converts electrical energy delivered to
the probe into ultrasound waves. These waves then travel
through the tissues, encountering the
blood, the heart, and other structures. Sound waves pass read-ily through
tissues of similar acoustic impedance; however, when they encounter different
tissues, they are scattered, refracted, or reflected back toward the ultrasound
probe. The echo wave then interacts with the ultrasound probe, generating an
electrical signal that can be reconstructed as an image. The machine knows the
time delay between the transmitted and the reflected sound wave. By knowing the
time delay, the location of the source of the reflected wave can be determined and
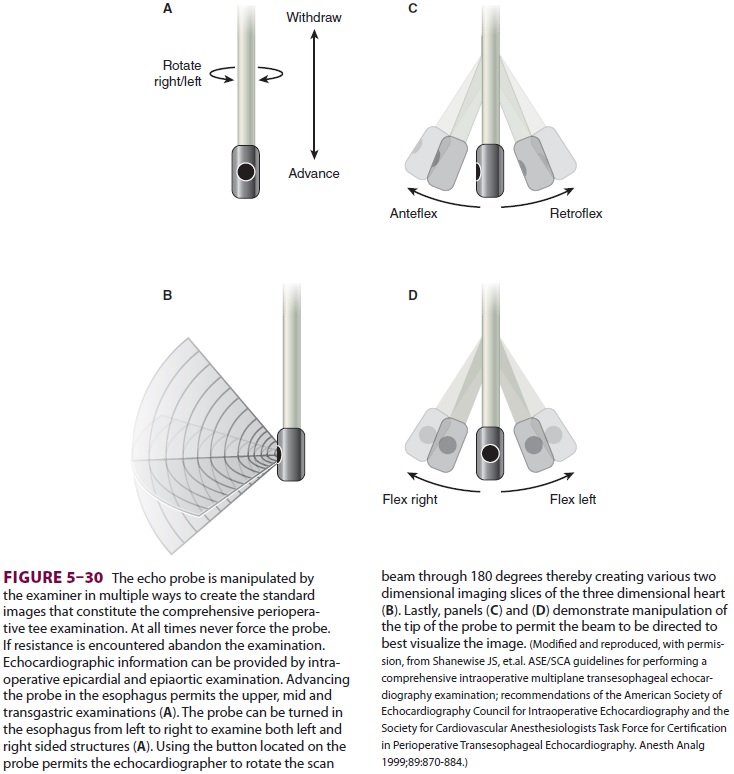
the image generated. The TEE probe contains myriad crystals generating and
pro-cessing waves, which then create the echo image. The TEE probe can generate
images through mul-tiple planes and can be physically manipulated in the
stomach and esophagus, permitting visualization of heart structures (Figure 5–30).
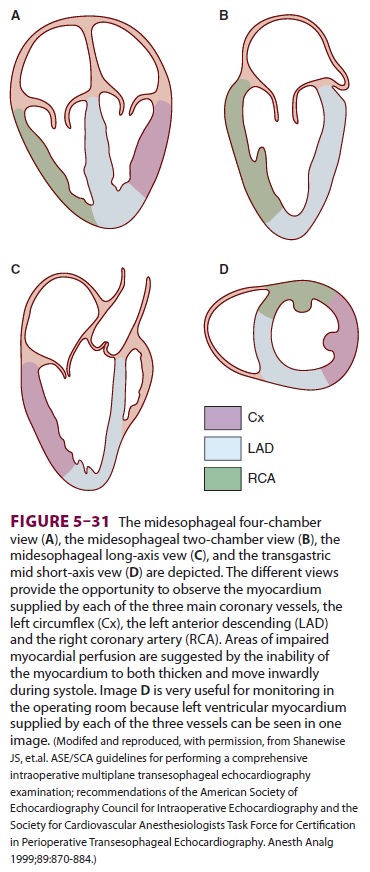
These views can be used to determine if the heart’s walls are being delivered
adequate blood supply (Figure 5–31). In the healthy heart, the
heart’s walls thicken and move inwardly with each beat. Wall motion
abnormalities, in which the heart’s walls fail to thicken during sys-tole or
move in a dyskinetic fashion, can be associ-ated with myocardial ischemia.
The Doppler effect is routinely used in
echocar-diographic examinations to determine the heart’s function. In the
heart, both the blood flowing through the heart and the heart tissue move
relative to the echo probe in the esophagus or on the chest wall. By using the
Doppler effect, it is possible for echocardiographers to determine both the
direction and the velocity of blood flow and tissue movement.
Blood flow in the heart follows the law
of the conservation of mass. Therefore, the volume of blood that flows through
one point (eg, the left ventricular outflow tract) must be the same volume that
passes through the aortic valve. When the path-way through which the blood
flows becomes nar-rowed (eg, aortic stenosis), the blood velocity must increase
to permit the volume to pass. The increase in velocity as blood moves toward an
esophageal echo probe is detected. The Bernoulli equation (pressure change = 4V2) allows echocardiographers to determine
the pressure gradient between areas of different velocity, where v represents
the area of
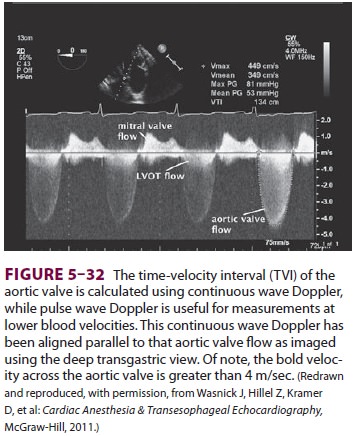
maximal velocity ( Figure 5–32). Using continuous
wave Doppler, it is possible to determine the maxi-mal velocity as blood
accelerates through a patho-logic heart structure. For example, a blood flow of
4 m/sec reflects a pressure gradient of 84 mm Hg between an area of slow flow
(the left ventricular outflow tract) and a region of high flow (a stenotic
aortic valve).
Likewise, the Bernoulli equation permits
echo-cardiographers to estimate PA and other intracavi-tary pressures, if
assumptions are made.
Assume P1>> P2
Blood flow proceeds from an area of high
pres-sure P1 to an area of low pressure P2.
The pressure gradient = 4V2, where V is the maximal velocity measured in meters
per second.
Thus,
4V2= P1− P2
Th us, assuming that there is a jet of
regurgitant blood flow from the left ventricle into the left atrium and that
left ventricular systolic pressure (P1)
is the same as systemic blood pressure (eg, no aortic ste-nosis), it is
possible to calculate left atrial pressure (P2).
In this manner, echocardiographers can esti-mate intracavitary pressures when
there are pressure gradients, measurable flow velocities between areas
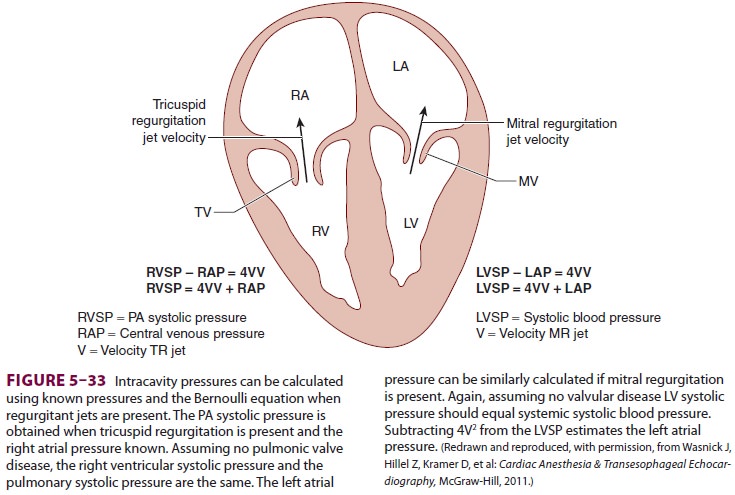
of high and low pressure, and knowledge
of either P1 or P2
(Figure 5–33).
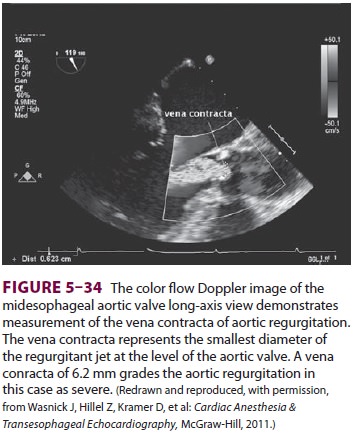
The Doppler principle is also used by
echo-cardiographers to identify areas of abnormal flow using color flow
Doppler. Color flow Doppler cre-ates a visual picture of the heart’s blood flow
by assigning a color code to the velocities in the heart. Blood flow directed
away from the echocardio-graphic transducer is color-coded blue, whereas that
which is moving toward the probe is red. The higher the velocity of flow, the
lighter the color hue (Figure 5–34). When the velocity of blood flow
becomes greater than that which the machine can measure, flow toward the probe
is misinterpreted as flow away from the probe, creating images of turbu-lent
flow and “aliasing” of the image. Such changes in flow pattern are used by
echocardiographers to identify areas of pathology.
Doppler can also be used to provide an
estimate of SV and CO. Similar to esophageal Doppler probes
previously described, TTE and TEE can be
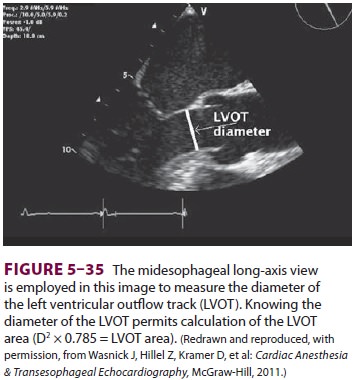
used to estimate CO. Assuming that the left ventricular outflow tract is a
cylinder, it is possible to measure its diameter (Figure 5–35). Knowing this, it
is pos-sible to calculate the area through which blood flows using the
following equation:
Area =
πr2= 0.785 × diameter2
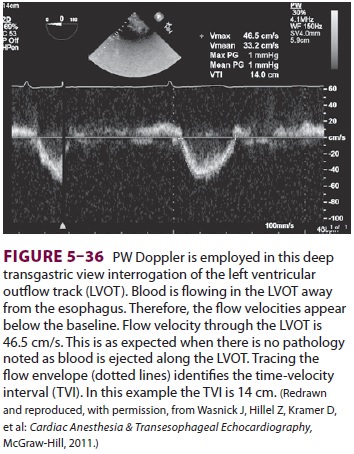
Next, the time velocity integral is
determined. A Doppler beam is aligned in parallel with the left ventricular
outflow tract ( Figure
5–36). The veloci-ties passing through the left ventricular outflow
tract are recorded, and the machine integrates the veloc-ity/time curve to
determine the distance the blood traveled.
Area × length = volume
In this instance, the SV is calculated:
SV × HR = CO
Lastly, Doppler can be used to examine
the movement of the myocardial tissue. Tissue veloc-ity is normally 8–15 cm/sec
(much less than that of
blood, which is 100 cm/s). Using the
tissue Doppler function of the echo machine, it is possible to dis-cern both
the directionality and velocity of the heart’s movement. During diastolic
filling, the lat-eral annulus myocardium will move toward a TEE probe. Reduced
myocardial velocities (<8 cm/s) are associated with impaired diastolic function
and higher left ventricular end-diastolic pressures.
Ultimately, echocardiography can provide
com-prehensive cardiovascular monitoring. Its routine use outside of the
cardiac operating room has been hindered by both the costs of the equipment and
the training required to correctly interpret the images. As equipment becomes
more readily available, it is likely that anesthesia staff will perform an
increas-ing number of echocardiographic examinations for hemodynamic monitoring
perioperatively. When questions arise beyond those related to hemody-namic
guidance, interpretation by an individual credentialed in advanced
perioperative echocar-diography is warranted.
Related Topics