Chapter: Pharmaceutical Drug Analysis: Infrared Spectrophotometry
Applications of IR-Spectroscopy in Analytical Chemistry
APPLICATIONS OF IR-SPECTROSCOPY IN ANALYTICAL CHEMISTRY
The technique of infrared spectroscopy has been
adequately exploited in the domain of analytical chemistry. This aspect is duly
expatiated with the aid of the following typical examples, namely :
1. DETERMINATION OF CIS-TRANS ISOMER RATIO IN CLOMIPHENE CITRATE
It is a gonad stimulating principle.
Theory : It is an established fact that cis-
and trans-substituted double bonds have slightly different absorption bands in the region of 13 μ m. This specific feature forms the basis of the present
determination.
Besides, the pharmacological actions of many compounds
are invariably dependent on the shape of molecules and hence, usually play a
very significant role. Therefore, if both cis-
and trans-isomers are pro-duced in
the course of a particular synthesis it may be absolutely necessary to
incorporate in the product profile a specific test for the relative proportions
of one to the other. This type of ‘control measure’ strictly conforms the
uniformity of composition in the bulk-drug industry and ensures a check on the
batch-to-batch variation.
Procedure : Dissolve accurately 22.5 mg of trans-clomiphene
citrate and 52.5 mg of cis-clomiphene citrate
(approx. 1 : 2.3) into 10 ml of DW in a clean 50 ml separating funnel. Add to
it 1 ml solution of sodium hydroxide (5% w/v in DW). In the alkaline medium the
base is liberated which is extracted successively with 3 portions of solvent
ether (10 ml each). The combined ethereal layer is washed with two portions of
DW (10 ml each). The resulting ethereal fraction is dried over anhydrous sodium
sulphate, filter, evaporate to dryness carefully over an electric water-bath
and dissolve the residue in 1 ml of CS2. Now, record the absorp-tion
curve in a 0.2 mm cell over the range 12.50 to 14.00 μ m. Calculate the absorbance for the peaks at 13.16 and
13.51 μ m respectively by employing
the base-line method between the minima at 12.66 and 13.89 μ m.
Finally, repeat the assay with a 1 : 1 mixture (75 mg) of
cis and trans-clomiphene citrates and also with clomiphene citrate (75 mg)
as such. Thus, calculate the ratio as follows :
Absorbance at 13.16 μ m / Absorbance at 13.51 μ m
with regard to each assay and therefrom confirm at the
ratios of the sample falls very much within the ratios for the standards
thereby indicating that the sample contains 50-70% cis-clomiphene citrate.
2. TO DISTINGUISH AND CHARACTERIZE THE PRI-, SEC-AND TERT-AMINE SALTS FROM ONE ANOTHER
Example : (+) Amphetamine Sulphate-a
pri-amine salt, χ-Ephedrine
Sulphate-a sec-amine salt, and Quinine Hydrochloride-a tert-amine
salt.
3. IR-SPECTROSCOPY IN THE STUDY OF COMPLEX FORMATIONS
The IR-spectroscopy has been judiciously used for the
study of complex formations.
Examples :
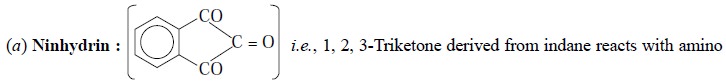
acids under appropriate conditions to result in the
formation of a deep blue complex.
This reaction is so sensitive that it forms the basis of quantitative complex
formation studies by IR-spectroscopy.
(b) 1 : 10-Phenanthrolin : reacts with Fe2+
ion quantitatively to give rise to a deep red complex due to formation of
phenanthroline-ferrous complex, which being extremely sensitive in nature is
usually exploited as the basis of quantitative complex formation studies by
IR-spectroscopy.
4. IR-SPECTROSCOPY IN QUANTITATIVE REACTION SEQUENCE STUDY
IR-spectroscopy technique has been used meaningfully in
the qualitative reaction sequence studies with regard to various organic
synthesis, namely : reduction of —NO2 group to —NH2 ;
reduction of  carbonyl group to —CH (OH) ; oxidation of methyl-group
to —COOH ; etc.
carbonyl group to —CH (OH) ; oxidation of methyl-group
to —COOH ; etc.
5. IR-SPECTROSCOPY IN THE IDENTIFICATION OF FUNCTIONAL GROUPS
A few salient features in this context are, namely :
(a) The absence
of a specific characteristic absorption may be more informative than its
presence, e.g., the presence vis-a-vis absence of a C = O str.
absorption.
(b)
Multifunctional compounds invariably exhibit altogether separate absorption
peaks due to the presence of individual functional groups. In a situation where
these functional groups interact with each other either absorption peaks merge
with one another or they shift from their original positions, for instance :
Glycine : H2N—CH2—COOH
(α-amino acetic acid
i.e., and aliphatic amino acid) ;
Pentane-2, 4-dione,
acetylacetone : CH3CO
CH2 COCH3-αβ-diketone
;
para-Hydroxybenzoic acid : HO—C6H4—COOH-αγ-hydroxy
acid (aromatic) ;
(c) Graphically
presented correlation tables, as cited in specialist texts of Cross, Bellamy
and Van der Mass, are found to be fairly precise and accurate for the critical
identification of functional groups. It is, however, pertinent to mention here
that the degree of accuracy lies between ± 5 cm –1 for ordinary
routine IR-spectrophotometers having lesser observed accuracy at higher
frequencies.
(d) Keeping in
view the vast wealth of expertise and experience, it may be inferred that the
maximum weightage can be solely rested on the absorptions either below 900 cm–1,
or above 1400 cm–1, for obvious reasons as the ‘fingerprint region’
900-1400 cm–1 mainly contains a plethora of unas-signed absorptions.
(a)
Group frequencies are invariably more readily accountable
and hence valuable in comparison to the corresponding single absorption bands.
It may be further expatiated due to the fact that a functional group which
often results in many specific and characteristic absorption bands can be
identified more precisely and definitely than a function which produces only
one characteristic absorption band. For instance :
(i) Esters : It affords group frequencies due to C = O str., and
C—O str. and hence more readily
identified than the ketones (C = O str.)
: It affords group frequencies due to C = O str., and
C—O str. and hence more readily
identified than the ketones (C = O str.)
(ii) Amides 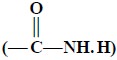 : It gives
rise to group frequencies on account of (C = O str., N—H str., N—H def.) and, therefore, more easily
identified than the corresponding amides.
: It gives
rise to group frequencies on account of (C = O str., N—H str., N—H def.) and, therefore, more easily
identified than the corresponding amides.
6. IR-SPECTROSCOPY : IDENTIFICATION BY FINGERPRINTING
The ‘fingerprint region’ lies between 1300-400 cm–1
which is considered to be the most valuable component of the spectra and mainly
comprises of a specifically large number of unassigned vibrations. Therefore,
IR-spectroscopy aids in the identification of unknown compound by comparing its
spectrum with a standard spectra recorded under exactly similar experimental
parameters. Thus, pharmaceutical substances that exhibit the same infrared
spectra may be inferred as identical.
Precisely in the domain of analysis by physico chemical
property IR-spectroscopy offers a far more characteristic, valid and qualified
‘proof of identity’ than the
comparison of any other physical property.
Precautions : Certain precautions may be
observed readily so as to obtain really identical spectra, namely :
(a) Sampling to
be done under identical conditions,
(b) Same
IR-spectrophotometer may be used for obtaining the various spectra, (c) Experimental parameters like :
slit-width, scan-speed etc., must be identical,
(d) An attempt
should be made to obtain the maximum number of peaks in the ‘fingerprint region’ thereby ascertaining
the proof of identity more
confidently.
Computer Aided Analysis : With the advent of spectacular
and quantum jump in the field of instru-ment technology over the past two
decades a good number of world-renowned manufacturers, such as : Beckman,
Bio-Rad, Brüker, Cecil, Hitachi, Nicolet, Perkin-Elmer, Schumadzu have
introduced various so-phisticated fully computerized FT-IR spectrophotometers.
These instruments have the advantage of storing in their computer-memory-banks
of sizable number of digitalized information obtained from the infrared spectra
of standard compounds. Now, with the flick of a keyboard button the spectrum of
an unknown compound, previously fed to the same digital storage bank, may be
conveniently compared with the stand-ards and finally to get at the identical
infrared absorptions to the unknown.
7. INTERPRETATION OF AN IR-SPECTRUM
There exist no hard and fast rules with regard to the
interpretation of an IR-spectrum, but based on the vast wealth of experience
and wisdom of the analyst amalgamated with a storehouse of general observations
go a long way towards the exact interpretation of the same. However, following
different aspects must be taken into consideration while interpreting the
spectrum :
(a)
In usual practice, the absence of a strong group
absorption definitely indicates the absence of that group in the molecule,
based on the assumption that no other factors are influencing which might shift
the absorption band to the other regions e.g.,
hydrogen bonding. In other words, intramolecular or intermolecular changes
caused due to the hydrogen bonding help in shifting the expected absorption
band either to the higher region or to the lower region. For instance : the
clear absence of a sharp and strong absorption band in the region 1850-1640 cm–1
(or 5.40-650 μ) completely excludes the
possibility of carbonyl groups from the molecular structure under
investigation.
(b)
It is quite important to carry out all the preliminary
examination of the IR-spectrum of an unknown compound exclusively and
definitely on the regions above 900-650 cm–1 (11.1-15.4 µ)
and above 1350 cm–1 (below
7.40 µ). For example :
(c) ‘Fingerprint Region’ i.e., the intervening region 1300-400 cm–1
essentially provides very useful information, specifically when examined with
reference to bands in the lower and higher regions. It frequently consists of a
relatively large number of bands the origin of which is neither located nor
determined so easily. Broadly speaking, the ‘fingerprint region’ helps in the
identification of unknown pharmaceutical substances with the aid of reference
samples and comparing the two spectra by superimposing them on one another. For
this reason many official compendia
like BP, USP provide the spectra of many pure and authentic pharmaceutical
substances that may be com-pared with the ones under investigation.
(d) Assignment of Bands to Specific Groups by
Employing Isotopes : Deuterium exchange is specifically beneficial for
assignment to A-H vibrations in a situation where the hydrogen is ex-changeable.
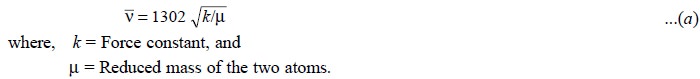
For a simple diatomic molecule X-Y the sole vibration
which may take place in a periodic stretch-ing along the X-Y band. Thus, the
stretching vibrations may be visualized as the oscillations of two entities
connected by a spring and the same mathematical treatment, known as Hooke’s Law, holds good to a first
approximation. Hence, for stretching of the band X-Y, the vibrational
fre-quency (cm–1) may be expressed by the following equation :
Therefore, for bands having the same force constant k :
 ......................................(b)
Thus, it may be shown that the absorption frequencies for
a bond involving deuterium are, to a rough approximation 1/√2 times the frequencies of the corresponding bonds
involving hydrogen.
Examples :
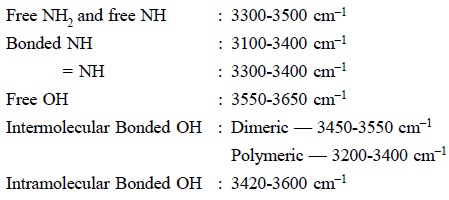
(i) Free OH
shows absorption at 3550-3650 cm–1 ; whereas OD shows absorption at
2400-2800 cm–1 ;
(ii) Free NH
shows absorption at 3300-3500 cm–1 ; whereas free ND shows
absorption at 2400-2600 cm–1.
In addition to the above cited typical instances the
hydrogen bonding can also be studied at length by subsequent replacement of
proton by deuterium.
(e) Assignment of Bands to Specific Groups by Affecting
Chemical Changes : Various chemical changes brought about in the organic
compounds may be assigned different absorption peaks on the specific modified
chemical entities. This can be explained with the help of the examples, namely
:
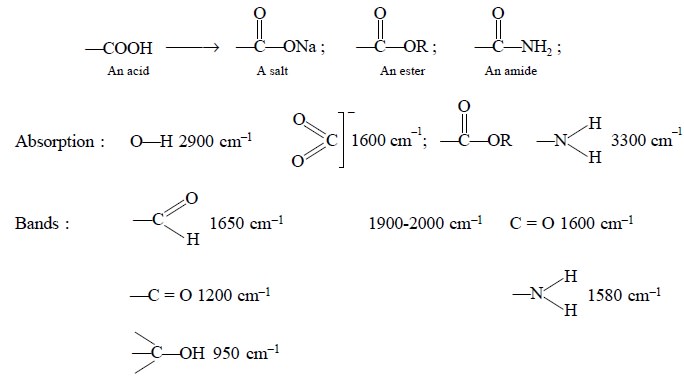
(i)
Conversion of an acid to its corresponding salt, or an
ester or a primary amide :
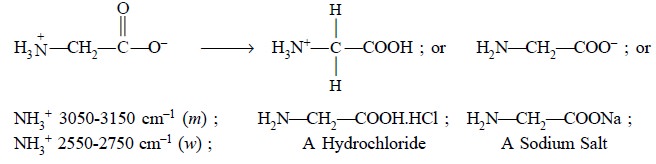
(ii)
Conversion of an Amino Acid to its corresponding hydrochloride
or salt :
Related Topics